Category: Lettuce

  • CA Utilized Vegetable Production Value Shows Slight Decline

    California leads the nation in vegetable production, accounting for 39% of the U.S. vegetable acreage. The value of California’s 2020 utilized vegetable production dropped 0.9% to $7.68 billion compared to 2019’s value of $7.74 billion according to the USDA National Agricultural Statistics Service, Pacific Regional Field Office.

    Despite the decrease in state’s overall total value of utilized production, crops showing an increase included broccoli, cantaloupe, lettuce of all types, sweet potatoes, and tomatoes. California fresh market and processing vegetable growers planted 939,700 acres of principal vegetable crops in 2020, down 3% from 2019. Utilized production totaled 433.8 million hundred weight up slightly from 2019’s 431.7 million hundred weight.

    USDA NASS recently posted the Vegetables 2020 Summary for vegetables grown during the 2020 crop year in California and across the U.S. The report includes survey data collected for acreage, production, marketing year price and value collected on an annual basis for 26 vegetable and melon crops in the U.S. Questionnaire content, survey timetables, and survey administration are state specific. Data are gathered by telephone interviews, mail-out/mail-back, faxed questionnaires, and personal interviews.

    Family favorites grown in California include artichokes, broccoli, carrots, garlic, tomatoes, and more. For a copy of the full report, visit Vegetables 2020 Summary. Just interested in California? Here are comments on 2020 crops where The Golden State is the largest producer. The data reflects U.S. numbers:

    Artichokes: Total production in 2020 totaled 812,000 cwt, down 15% from 2019. Planted area was estimated at 5,900 acres, down 11% from the previous year. Area harvested, at 5,800 acres, was down 12% from 2019. The value of the crop totaled $62.6 million, 16% below the previous season. Utilized production totaled 792,500 cwt, all of which was for the fresh market. In California, artichokes enjoyed a routine spring with strong supplies and steady demand. The March increase could be attributed to consumers pushing the demand for healthy vegetables. The pandemic temporarily impacted labor availability and elevated production costs, but generally favorable weather resulted in good quality and production.

    Broccoli: Total production in 2020 totaled 15.8 million cwt, down 5% from 2019. Planted area was estimated at 100,900 acres, down 4% from the previous year. Area harvested, at 100,300 acres, was also down 4% from 2019. The value of the crop totaled $875 million, 3% more than the previous year. Utilized production totaled 15.8 million cwt, of which 15.3 million cwt was for the fresh market and 25,060 tons for processing. In California, the pandemic caused a variety of changes in the marketplace. Most notably was the decreased demand from the food service industry for broccoli. Growers plowed under broccoli due to limited demand by the hospitality industry.

    Cabbage: Total production in 2020 totaled 23.7 million cwt, up 6% from 2019. Planted area was estimated at 60,600 acres, down 3% from the previous year. Area harvested, at 58,600 acres, was down 3% from 2019. The value of the crop totaled $428 million, 16% less than the previous season. Utilized production totaled 23.6 million cwt, of which 19.1 million cwt was for the fresh market and 224,241 tons for processing. In California, weather during the planting in the fall of 2019 and through head development in 2020 was favorable. No reports of pathogen impact were reported for the crop.

    Cantaloupes: Total production in 2020 totaled 11.3 million cwt, a slight increase from 2019. Planted areas was estimated at 41,000 acres, down 15% from the previous year. Area harvested, at 40,600 acres, down 15% from 2019. The value of the crop total was $296 million, an increase of 24% from previous year. The utilized production was 11.3 million cwt, all of which was for the fresh market. In California, lack of rainfall during the spring months and high temperatures during the summer months provided ideal growing conditions for cantaloupes compared to last year.

    Carrots: Total production in 2020 totaled 31.1 million cwt, down 6% from 2019. Planted area was estimated at 69,900 acres, down 4% from the previous year. Area harvested, at 69,700 acres, was down 3% from 2019. The value of the crop totaled $716 million, 7% less than the previous year. Utilized production totaled 31.1 million cwt, of which 22.3 million cwt was for the fresh market and 441,787 tons for processing. In California, the largest producing State, the carrot market was steady through the spring of the year. In the heavily farmed central portion of the Cuyama Valley, where a lot of California’s carrots are grown, the water table continued to drop in 2020.

    Cauliflower: Total production in 2020 totaled 9.0 million cwt, down 11% from 2019. Planted area was estimated at 42,500 acres, down 6% from the previous year. Area harvested, at 42,200 acres, was down 7% from 2019. The value of the crop totaled $346 million, 25% less than the previous season. Utilized production totaled 8.9 million cwt, of which 8.8 million cwt was for the fresh market and 2,724 tons for processing. In California, growers have seen dramatic movement of cauliflower during the pandemic. This year has seen generally shrinking volume from the beginning of February, and lower volume than the previous two year since the beginning of March. Pricing is below the prior two years and continues decreasing, although price has not stabilized, the rate of decrease has slowed.

    Celery: Total production in 2020 totaled 16.1 million cwt, up 2% from 2019. Planted area was estimated at 29,200 acres, up 4% from the previous year. Area harvested, at 28,800 acres, increased 2% from the previous year. The value of the crop totaled $359 million, down 24% from previous year. Utilized production for 2020 totaled 16.1 million cwt, up 2% from 2019.
    In California, growers reported higher production but price dropped considerably.

    Garlic: Total production in 2020 totaled 3.46 million cwt, down 10% from 2019. Planted area was estimated at 24,700 acres, unchanged from the previous year. Area harvested, at 24,700 acres, was unchanged from 2019. The value of the crop totaled $264 million, 12% less than the previous season. Utilized production totaled 3.46 million cwt, of which 1.21 million cwt was for the fresh market and 112,385 tons for processing. In California, producers were tempered by soil borne pathogens that reduced yield in some areas, though overall the growing season experienced favorable weather.

    Honeydew: Total production in 2020 totaled 2.36 million cwt, down 9% from 2019. Planted area was estimated at 7,600 acres, down 25% from the previous year. Area harvested, at 7,600 acres, was also down 25% from 2019. The value of the crop totaled $49.2 million, down 11% from the previous season. Utilized production totaled 2.36 million cwt, all of which was for the fresh market. In California, lack of rainfall during the spring months and high temperatures during the summer months provided ample growing conditions for honeydew compared to last year.

    Head lettuce: Total production in 2020 totaled 40.7 million cwt, down 3% from 2019. Planted area was estimated at 114,000 acres, down 2% from the previous year. Area harvested, at 112,900 acres, was down 3% from 2019. The value of the crop totaled $1.25 billion, 12% less than the previous season. Utilized production totaled 40.7 million cwt, all of which was for the fresh market. In California, the largest producing State, higher than normal temperatures in the central valley resulted in substantial losses. In the coastal region, warm weather and wildfires affected supplies later in the year. Significant occurrences of crop disease also contributed to a tight market, prompting concerns of shortages in other parts of the country. Some producers in Arizona and California have allowed some head lettuce to die in the field or to be disced under, due to decreased sales to food service companies.

    Leaf lettuce: Total production in 2020 totaled 15.6 million cwt, up 25% from 2019. Planted area was estimated at 62,900 acres, up 9% from the previous year. Area harvested, at 61,700 acres, was also up 8% from 2019. The value of the crop totaled $800 million, 23% more than the previous season. Utilized production totaled 15.6 million cwt, all of which was for the fresh market. In California, some growers did not harvest their fields during the spring in response to market conditions, but demand improved as the year progressed. There was a small amount of heat damage to the crop, but yields were up significantly from the previous year. Quality was reported to be fair and demand was strong enough to keep prices up. However, some producers in Arizona and California have allowed some leaf lettuce to die in the field or to be disced under, due to decreased sales to food service companies.

    Romaine lettuce: Total production in 2020 totaled 30.3 million cwt, up 11% from the 2019 total. Planted area was estimated at 93,100 acres, up 4% from the previous year. Area harvested, at 91,500 acres, was up 4% from 2019. The value of the crop totaled $948 million, 8% more than the previous season. Utilized production totaled 30.3 million cwt, all of which was for the fresh market. In California, there were quality issues in the late summer crop as instances of Sclerotinia and Impatiens Necrotic Spot Virus were found in the Central Coast region. In November, there was a voluntary recall of Romaine lettuce due to a potential outbreak of E.coli. Overall, yields were up from a year ago. Some producers in Arizona and California have allowed Romaine lettuce to die in the field or to be disced under, due to decreased sales to food service companies.

    Onions: Total production in 2020 totaled 75.2 million cwt, up 8% from 2019. Planted area was estimated at 134,700 acres, up 2% from the previous year. Area harvested, at 132,800 acres, was up 3% from 2019. The value of the crop totaled $878 million, 12% less than the previous year. Utilized production totaled 73.5 million cwt, of which 49.5 million cwt was for the fresh market and 1.20 million tons were for processing. In California, the largest producing State, growers reported the summer being too hot too early. Later in the summer there wasn’t enough sun when wildfires blanketed the state in smoke for months.

    Bell peppers: Total production in 2020 totaled 11.7 million cwt, up 1% from 2019. Planted area was estimated at 38,100 acres, up 1% from the previous year. Area harvested, at 37,100 acres, was up 1% from 2019. The value of the crop totaled $479 million, 11% less than the previous year. Utilized production totaled 11.7 million cwt, of which 8.22 million cwt was for the fresh market and 171,808 tons for processing. In California, the summer turned very hot early, which quickly turned bad as fires ravaged through large portions of the state burning cropland and producing a thick layer of smoke blocking the sun for months. Some producers had to divert peppers intended for fresh market to processors as state lockdowns caused stoppages in the supply chain.

    Spinach: Total production in 2020 totaled 7.23 million cwt, down 24% from 2019. Planted area was estimated at 56,800 acres, down 14% from the previous year. Area harvested, at 56,200 acres, was also down 14% from 2019. The value of the crop totaled $439 million, 28% less than the previous season. Utilized production totaled 7.23 million cwt, of which 6.45 million cwt was for the fresh market and 39,204 tons for processing. In California, the largest producing State, the coastal regions experienced damaging cold temperatures in early spring, bringing yields down below last year. Acreage decreased after some growers responded to a drop in demand by plowing under their fields.

    Sweet potatoes: Total production in 2020 totaled 30.7 million cwt, down 4% from 2019. Planted area was estimated at 158,000 acres, up 7% from the previous year. Area harvested, at 156,800 acres, was up 7% from 2019. The value of the crop totaled $726 million, 10% more than the previous season. Utilized production totaled 30.6 million cwt, of which 23.9 million cwt was for the fresh market and 331,638 tons for processing.

    Tomatoes: Total production in 2020 totaled 241 million cwt, up 1% from 2019. Planted area was estimated at 280,000 acres, down 1% from the previous year. Area harvested, estimated at 272,900 acres, was down slightly from 2019. The value of the crop totaled $1.66 billion, 4% more than the previous season. Utilized production totaled 239 million cwt, of which 12.6 million cwt was for the fresh market and 11.3 million tons for processing. In California, there were no major issues during planting, but higher than average temperatures in late spring affected early crop yields. Inconsistent weather patterns throughout the growing season prompted short interruptions in the flow of ripe tomatoes. Wildfires that raged through the state in late summer and early fall slowed the processing tomato harvest. Crop quality varied by region and disease pressure was low. Due to a lack of rain, water availability continued to be a concern.

    For more agricultural statistics, visit www.nass.usda.gov.

  • UC Cooperative Extension Investigates the Reality of Steam-Weeding Lettuce Fields

    Despite the tremendous need, there are currently no preemergence herbicides that are organic-compliant. Steam injected into the soil such that the soil temperatures reach >140°F for 15-20 minutes will kill weed seed in the soil. The effect of this reduction in the seedbank viability results weed control in the treated area that persists for several weeks or months, similar to the effects of a preemergence herbicide.

    Two studies were conducted at the USDA Hartnell Farm at Salinas, CA during July to September 2020. Steam was applied to raised beds using a custom-built steam injector. Prior to seeding lettuce, steam was applied in a 4-inch wide band to a depth of 3 inches deep. The steam was supplied by a SF-20 Sioux steam generator at approximately 6 to 9 PSI. Soil temperatures in the treated zone were monitored overnight with Hobo temperature monitors. Treatments tested were steam, steam plus 1% w/w peroxide, and nontreated. Treatments were replicated 4 times and arranged in a randomized complete block design. Peroxide was included as it releases heat when injected into soil, i.e., an exothermic reaction, based on the premise that it supplements the heat released by steam. Data collected were soil temperatures following steaming, weed control, hand weeding times, diseased plant counts, and lettuce yields. Trial 1 was initiated July 1 and harvested August 31, 2020. Trial 2 was initiated July 21 and harvested September 25, 2020. Soil temperature intervals >140°F in the top 4 inches of soil for steam were 88 and 67 minutes for trials 1 and 2, respectively. Similarly, soil temperatures >140°F in the steam + peroxide treatment were 76 and 80 minutes for trials 1 and 2, respectively. In trial 1 steam and steam + peroxide resulted in 90% and 92% weed control relative to the nontreated. In trial 2 steam and steam + peroxide resulted in 66% and 84% weed control, respectively. Steam alone reduced hand weeding times 22% to 35% compared to the nontreated, and steam + peroxide reduced hand weeding times 36% to 40% compared to the nontreated. There were no differences in numbers of plants with lettuce drop (Sclerotinia minor) in trial 1. Compared to the nontreated, lettuce drop incidence in trial 2 was 66% and 59% lower in steam and steam + peroxide treatments, respectively. Lettuce plant diameters in trial 1 found that lettuce grown on steamed soil was 16% larger, but there were no differences in trial 2. Lettuce plants grown on steam + peroxide treated soil were 12% and 23% larger in trials 1 and 2, respectively. There were no treatment effects on yields in either trial 1 or 2.

    We are not aware of any commercial scale applicators for lettuce that apply steam in a band to the lettuce bed. However, we are working with Dr. Mark Siemens, an agricultural engineer with the University of Arizona to design a commercial scale applicator. Mark has a prototype applicator built and will be demonstrating it during the winter season in the Yuma Valley. It appears that the design for a steam applicator is not complicated and is well within the capabilities of machine shops in California to build. — By Nelly Guerra & Steven Fennimore, UC Cooperative Extension

  • Pythium & INSV Infections in Salinas Lettuce Fields

    In 2020 the incidence of Pythium wilt (caused by Pythium uncinulatum) of lettuce has increased in severity and in the number of affected fields. Pythium infections in lettuce fields have been observed frequently, but not always, occurring with INSV infection. As a result, there has been confusion distinguishing between these two diseases and the role of each of them in causing the problems in fields. In this blog we will discuss these two diseases and explain from our current state of knowledge about the disease dynamics occurring in affected fields.

     INSV has been a production problem on lettuce in the Salinas and surrounding valleys for a number of years and in 2020 it continues to be a serious production issue. Pythium wilt of lettuce is a relatively new problem and was first discussed in a blog entry in October 2015 by Steve Koike (https://ucanr.edu/blogs/blogcore/postdetail.cfm?postnum=19327 ). However, in 2019 and 2020 we have seen an increase in the number of acres affected by Pythium wilt as well as the severity within fields. Given that Pythium is a relatively new problem and the extent of the problem suddenly increased, some growers and PCAs are confronting this problem for the first time. To add to the confusion, at times INSV and Pythium infections are occurring together on the same plants which has caused confusion and has led to much speculation about the role of each disease in the observed damage.

    Symptoms of INSV

    Issues with INSV infections on head and leaf lettuce types are not a new occurrence in the Salinas Valley and many growers and PCAs are familiar with the symptoms and the patterns of infection in the field, especially on romaine. In general, INSV on lettuce causes characteristic patterns of chlorosis and necrosis on the inner leaves of the plant, as well as significant stunting (Photo 1). However, INSV can cause significant necrosis and lesions on and at the base of the ribs of lettuce plants (Photo 2). It should be mentioned that Tomato Bushy stunt virus (TBSV) can cause symptoms that can be confused with INSV and Pythium wilt; however, lettuce dieback symptoms are always seen on the outer, older leaves and the TBSV pathogen is commonly restricted to low-lying areas along the river. In addition, head lettuce varieties and some romaine varieties are resistant to this virus. When in doubt, it is important to have a sample tested. That said, INSV is the overwhelming virus issue facing growers and PCAs in 2020.

    Moderate to severe symptoms of INSV on ribs of romaine.

    Viral vs. Fungal Symptoms

    One important detail about lettuce plants infected with only INSV is that they do not exhibit wilting of the outer leaves of the plant or show root rot or root discoloration. This is important to note because in 2019 and 2020 we have visited many fields where the plants exhibit symptoms of INSV and have wilting older leaves. In these situations,  the roots and crowns of the plants should be examined for symptoms caused by soilborne pathogens such as the wilt pathogens (Fusarium and Verticillium), Sclerotinia, and Pythium. Fusarium and Verticillium do not cause rot on the fine roots or crown. However, they always cause characteristic vascular discoloration in the taproot and crown of the plant. Distinguishing these two pathogens without a laboratory evaluation is not advised, but in general, Fusarium occurs earlier in the crop cycle and often causes a red-to-brown discoloration internally along the taproot and at the base of the crown. Symptoms of Verticillium on the above ground parts of head lettuce become obvious close to harvest; the taproot and crown tissue of infected plants have dark brown-to-black discolorations. Plants with INSV can also be infected with Sclerotinia (S. minor) which is recognized by the characteristic rotting of the crown tissue of the plant and the presence of white, cottony growth and small blacksclerotia (Photo 3). Plants infected with Sclerotinia easily break off at the soil line when you gently tug on them. However, if the plants do not break off at the soil line and do not show any rot on the crown tissue but do exhibit rot on the fine feeder roots or lower down on the taproot, then Pythium wilt is suspected and can be verified by laboratory evaluation.

    Sclerotinia infection on lettuce. Note that it infects and rots crown tissue of the plant.

    Biology and Symptoms of Pythium

    Pythium wilt is caused by the water mold, Pythium uncinulatum. It infects lettuce roots with swimming spores (zoospores) that move to the roots within the water film in the soil. Additionally, it produces a second type of spore (oospore) that allows the pathogen to survive in the soil in the absence of a host plant. Previous studies have reported P. uncinulatum is almost exclusively a pathogen of lettuce and does not cause disease on other vegetable crops. However, it remains unknown whether other crops may contribute to a build-up of the pathogen in the soil. Affected plants will exhibit rotting of the fine and tap roots (Photo 4) and frequently dark discoloration of the inner core of the main root (Photo 5). Symptoms of the above ground parts of the plant include stunting, yellowing, and wilting of the outer leaves and eventual death (Photo 6). Sometimes the plants have a characteristic look where the younger leaves remain upright, but the older leaves are totally wilted down to the soil (Photo 7). This year, we frequently observed fields where plants are infected with Pythium wilt but are also infected with INSV. These mixed infections are confusing and make it more difficult to distinguish what is the cause of the damage. In our experience to date, plants that show foliar symptoms of INSV and that have wilting older leaves are typically infected with both INSV and, in many cases, Pythium wilt. It should be mentioned that we have also observed plants infected with INSV as well as Fusarium.

    Pythium wilt infection of fine lettuce roots.
    Pythium wilt infection on lettuce taproot.
    Mini romaine infected with Pythium wilt.
    Romaine infected with INSV and Pythium wilt. Note that the older leaves are wilted and lay on the ground.

    The distribution of Pythium wilt in a lettuce field can be variable. Earlier in the summer, fields with this disease typically were infected along the upper or lower ends of the field indicating that the disease may be responding to irrigation or drainage issues. It is possible that there may be a difference in the level of infection between sprinkler and drip irrigated fields, but we cannot say anything definitive at this time. The disease has been found from King City to Castroville. There is a significant difference in the susceptibility of varieties. In fields with multiple leaf type lettuce, we have observed significant differences in susceptibility among varieties with red types being less susceptible (Photo 8). Recently, there have been severe losses in some fields. It is not clear as of this writing, but it is possible that the incidences occurred in response to the heat spells. It is likely that diseased plants were not able to withstand the weather stress due to damaged roots or that extra water applied to address the heat may have stimulated the development of Pythium wilt. Another observation we have made is that at times Pythium mostly infects the fine roots higher up on the root system and in other situations it is more severe at the bottom of the taproot (Photo 9) which may indicate disease initiated farther down on the root system. Given that the disease needs a period of soil saturation for the swimming spores to travel to the roots, issues with soil preparation, drainage and irrigation management may affect the severity of the disease.

    Difference in susceptibility of two green leaf lettuces and a green leaf and red leaf lettuce to Pythium.
    Plant with Pythium wilt infection lower down on the tap root (note the plant on the top with healthy fine roots higher up and infected tip of the tap root).

    Research Efforts

    Daniel Hasegawa is conducting research on the epidemiology and spread of thrips and INSV. JP Dundore Arias is working on a project with the California Leafy Greens Research Board monitoring the occurrence of Pythium wilt in the Salinas Valley. He is also characterizing isolates of this disease to better understand the organism and will be conducting preliminary evaluations of the sensitivity of the organism to fungicides. Given the rapid onset of severe damage of Pythium and the continued severity of INSV, we are trying to better understand these diseases and how they may interact. We are interested in receiving samples of Pythium wilt. Please contact Richard (rifsmith@ucdavis.edu) or JP (jdundorearias@csumb.edu) to submit samples.

    Authors: Richard Smith, JP Dundore Arias, Daniel Hasegawa and Steve Koike

    Farm Advisor, UCCE Monterey; Plant Pathology Professor, Cal State Monterey Bay; Research Entomologist, USDA ARS; Director, TriCal Diagnostics, respectively

  • Weed Control in Lettuce

    Weed control in lettuce and other crops is a key issue this time of year. Purslane is particularly problematic and is adapted to warm conditions and can grow very rapidly especially during July and August. At times growers and PCA’s are disappointed with the efficacy of Kerb on this weed. Kerb is effective in controlling purslane but it is readily leached and, if applied at planting, it can be moved below the zone of germinating weed seeds with the germination water. For instance, 6-8 hours of sprinkler water (1.5 to 2.0 inches) are commonly applied in the first germination water which can move the Kerb below the upper 0.5 inch of soil which is the zone where the weed seeds germinate; the movement of Kerb with the germination water is particularly problematic on sandy soils. Prefar does not leach and thus provides most of the purslane control when the two materials are tank mixed (Figure 1). However, Prefar does not control shepherd’s purse or nightshades which can also be problematic in lettuce fields. Therefore, it would be advantageous to optimize the efficacy of Kerb to maximize the control of purslane as well as other weeds.

    In the desert, the use of delayed applications of Kerb has been used for many years. Due to the large amounts of water that are applied in their hot conditions, Kerb is applied in the 2nd or 3rd germination water, approximately 3-5 days following the first germination water, just prior to the emergence of the lettuce seedlings. This technique can also be utilized in the Salinas Valley. We have looked at this technique over the years and have found it to improve the efficacy of Kerb (Figure 2).  These data illustrate the loss of control of purslane by Kerb when applied before the 1st germination water, as well as the improvement in efficacy that results when applied following the 1st germination water. It also illustrates the role that Prefar plays in the control of purslane when the efficacy of Kerb is lost by leaching. It should be mentioned that the label states that the maximum amount of Kerb that can be applied through the sprinklers is 2.5 pints/A and the amount used in this trial was for experimental purposes only. Clearly there is benefit from applying the Kerb later in the 2nd or 3rd germination water, however, we observed that applying the Kerb at the end of the 1st germination water also provided improved efficacy of Kerb. Clearly, anything that helps to keep the Kerb in the top 0.5 inch of soil improves its efficacy.

    Here are some details that need to be considered regarding the application of Kerb later in the germination phase of the crop: There is a need to use an injection pump and tank. We have typically used a tank with a circulating mechanism to keep the Kerb in suspension while the injection was occurring. The material needs to be injected into the mainline in a location where proper mixing can occur before it begins to flow down the laterals. The most difficult issue that growers face is the compatibility of the injection with surrounding crops. This is probably the greatest challenge and must be carefully thought through before attempting an application.

    Another idea that we explored last year was the use of an additive to help retain the Kerb in the upper portion of the soil where it can be most active. However, we did not see improved efficacy in two 2018 trials (data not shown).

    Many growers now are now using drip irrigation to germinate lettuce. Grower may apply the same amount of water with drip germination as with sprinklers, but the movement of the water is different which affects a surface applied material differently. With this method of germination, there are a couple of interesting dynamics that occur: 1) Kerb is not pushed too deep by this germination method and effectively reduces weed populations whether injected into the germ water (currently not a registered method of application) or sprayed on the soil surface and activated by the drip germination water (Table 1); and 2) fewer weeds emerge with drip germination than with sprinklers, regardless of the herbicide program.

    Figure 1. On left: Kerb at 3.5 pints/A applied at planting; On right Kerb at 3.5 pints/A + Prefar at 1.0 gallon/A applied at planting. The main weed is common purslane which was not controlled by Kerb because it was pushed below the zone of germinating weed seeds by the germination water


    Figure 2. Efficacy of Kerb applied at 3.5 pints/A at planting or in the 3rd germination water; crop was romaine. Note that applying the Kerb after the first heavy application of germination water greatly improved its effectiveness.

  • The Recent Romaine Recall and the LGMA

    Although the Center for Disease Control announced on January 9, 2019 that the recent e-coli outbreak is over, there is another part of the story that doesn’t seem to be getting allot of traction. During the investigation the FDA made the comment that based on the spread of the traceback it’s highly unlikely that it originated from a single farm. I don’t have any first-hand knowledge that hasn’t already been publicly disclosed, but I do understand how the produce supply chain works. A single source could be a possible scenario when you think through how one farm can go to multiple processors and terminal markets. There are two troubling allegations floating around about this outbreak that need put to rest.

    First, that the only grower/shipper implicated so far was not a member of the California Leafy Greens Marketing Agreement (LGMA). The LGMA recently sent out a statement confirming that is accurate so that’s not up for further debate. Since it was formed in 2006 the backbone of the LGMA has been that members voluntarily subject themselves to minimum food safety standards verified through unannounced inspections conducted by California Department of Public Health (CDPH) inspectors. The LGMA was never intended to stop all recalls but that through a HACCP type approach to continuously reduce risk starting at the field. Since the marketing agreement was voluntary the failsafe were the commitments made by some of the largest retailers and food service distributors at the time that their buy side would support LGMA members for West Coast sourced leafy greens.

    Being a member of the LGMA is not cheap. One recent study suggested that the incremental cost per acre since 2006 to abide by all of the minimum food safety standards and inspections that come with LGMA is close to $180 per acre. A non-LGMA farm can have the most stringent standards in the industry on paper. However, without incurring the incremental costs associated with maintaining “trust but verify” standards, supported by unannounced site audits they would have a substantial cost advantage over LGMA members.

    The second issue is how a non-LGMA member can get their leafy greens into the retail and food service channels. Just prior to the outbreak the romaine supply was extremely tight in many areas which was reflected in the USDA Mostly Market reports for romaine. Maybe it’s just coincidence, or maybe there is a hole in the process that the buy side needs to step up and address, especially when the industry is short. This is the second recall situation I am aware of in the past three years where the trace back implicated a California shipper/handler that was not an LGMA member.

    I’m not suggesting that somehow LGMA members have a safer product than anyone else. I am suggesting that we owe it to ourselves as an industry and to consumers to ensure that everyone is at least working from the same floor. How high someone wants to go above that floor is an individual business decision. The LGMA may not be the perfect solution to maintaining minimum standards on an industry wide basis, but right now it’s the only solution.

    If the buy side isn’t going to step up and support LGMA for leafy greens sourced from the West Coast, especially when supplies are tight, then maybe it’s time to rethink it. When everyone is allowed to revert back to their own standards, then we really have no standards which is where we were in 2006.

  • Got “Red” Aphids?

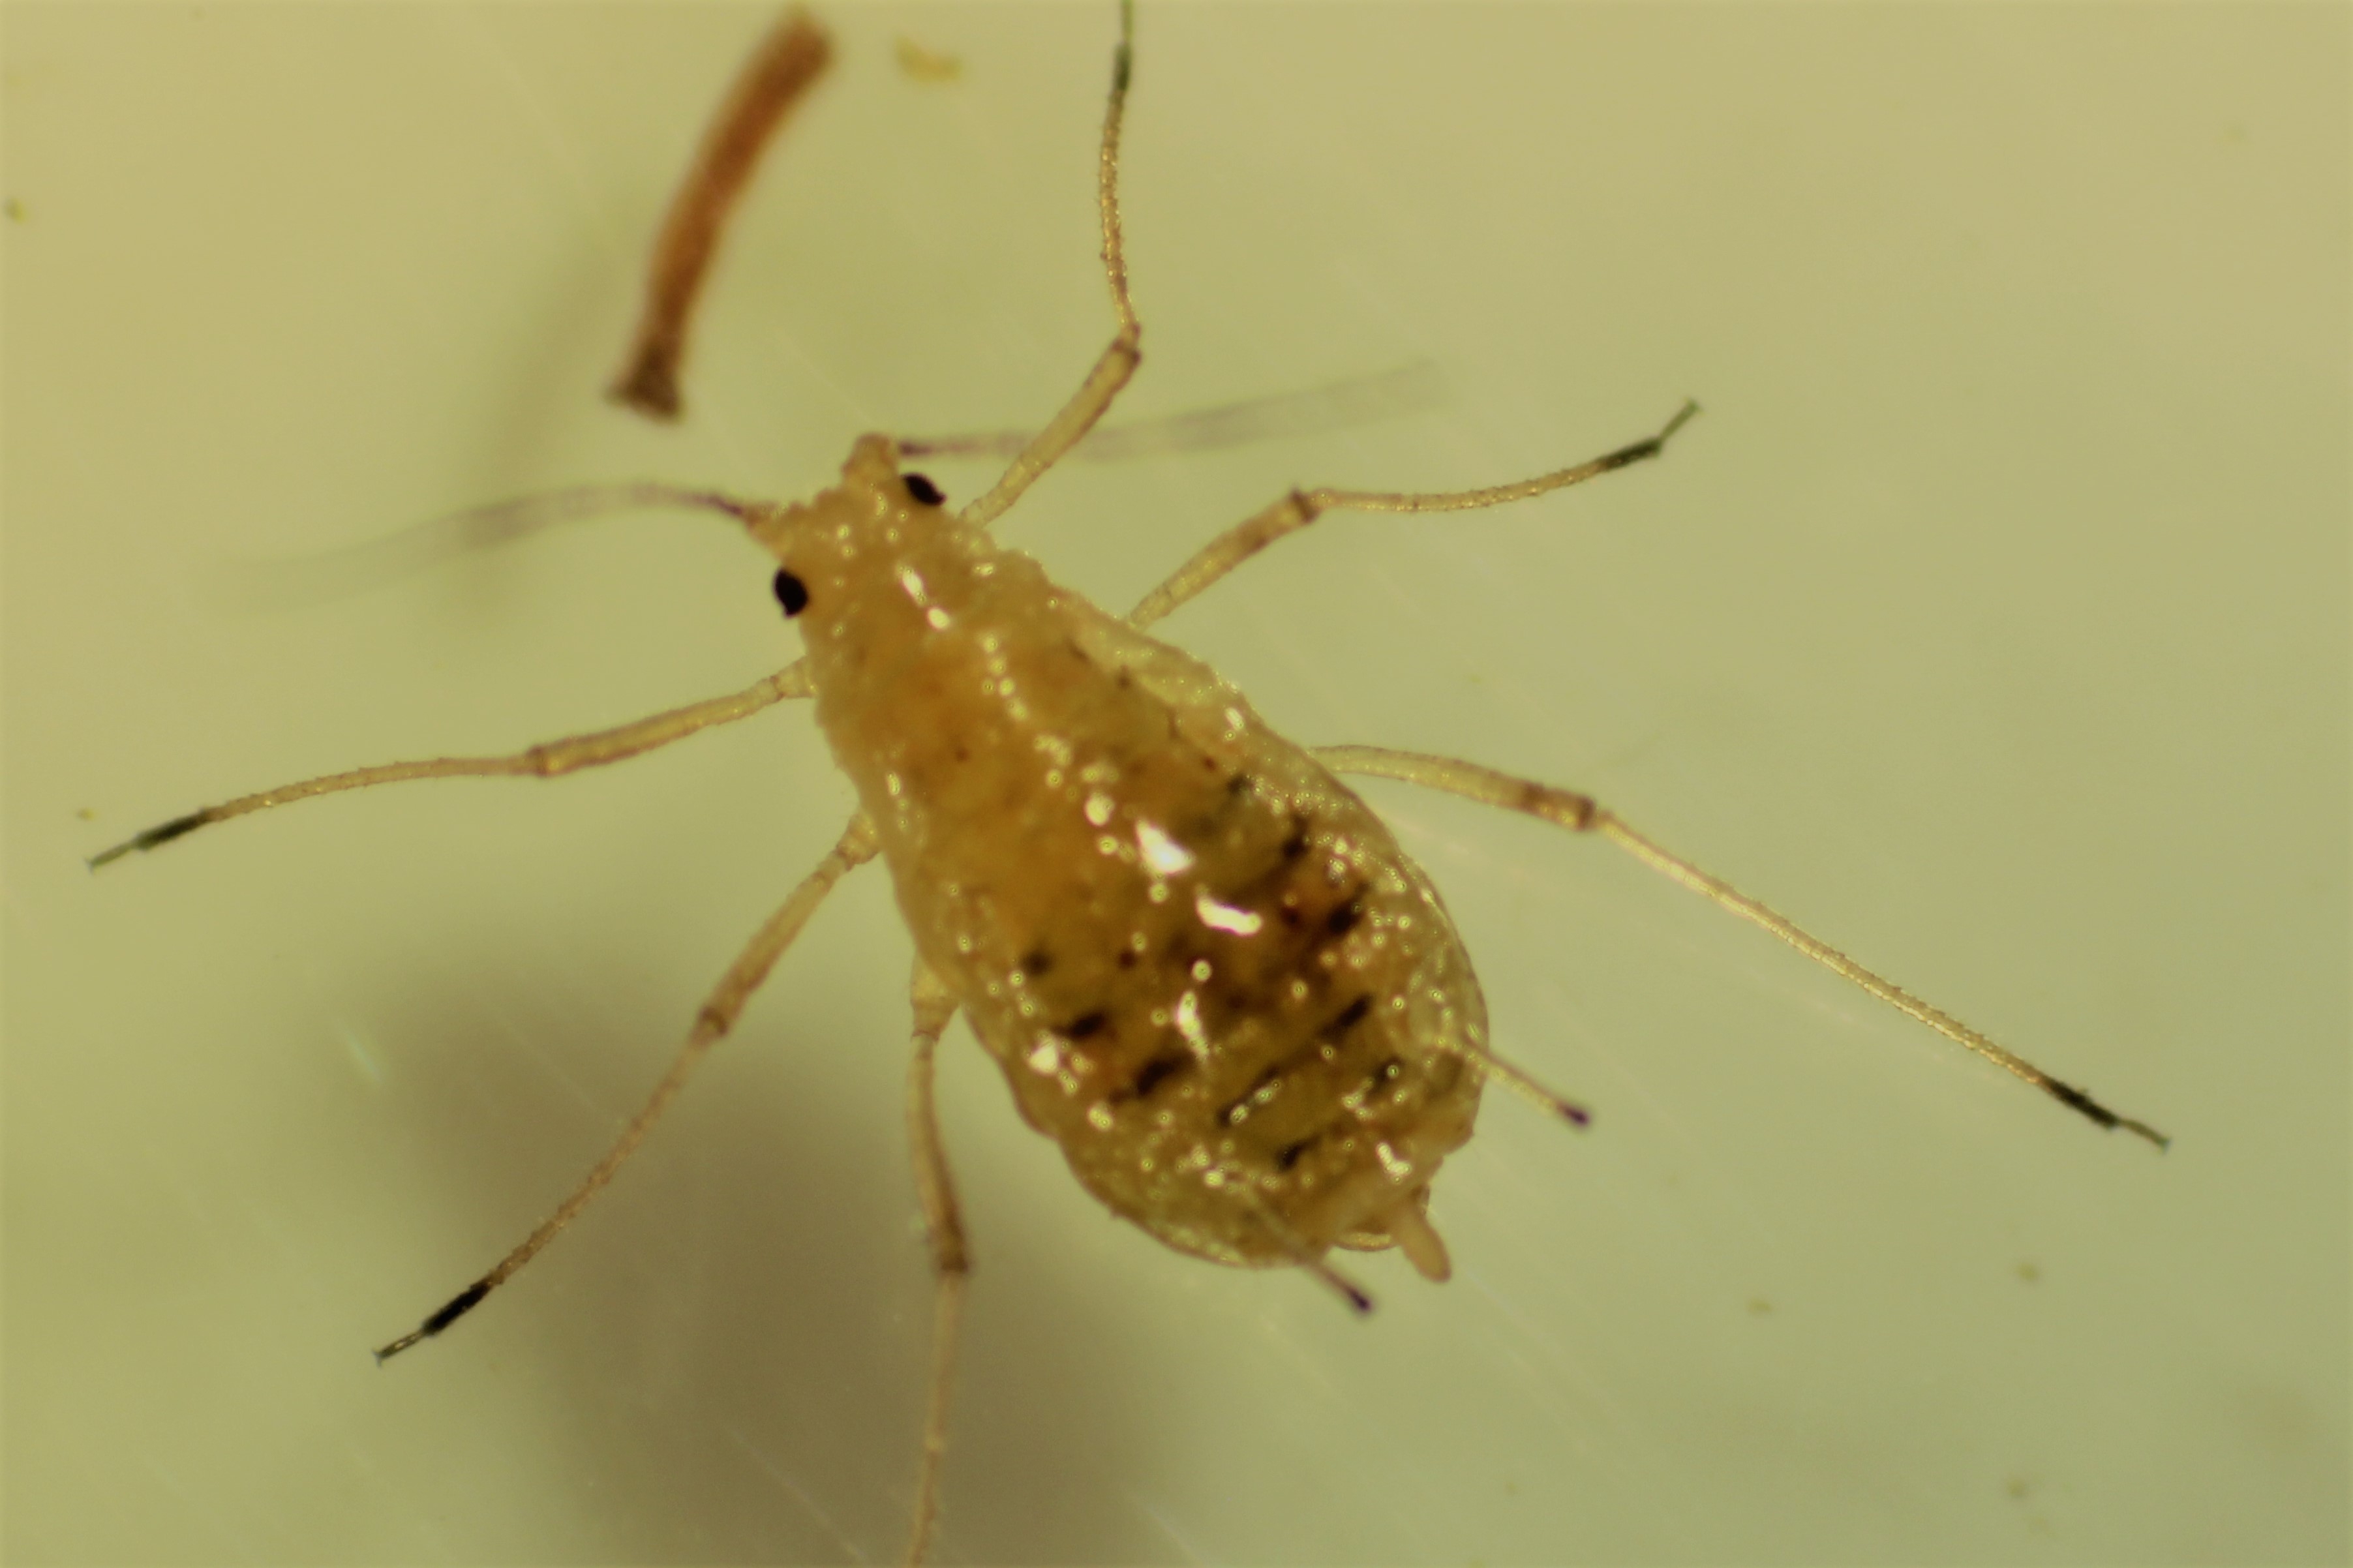
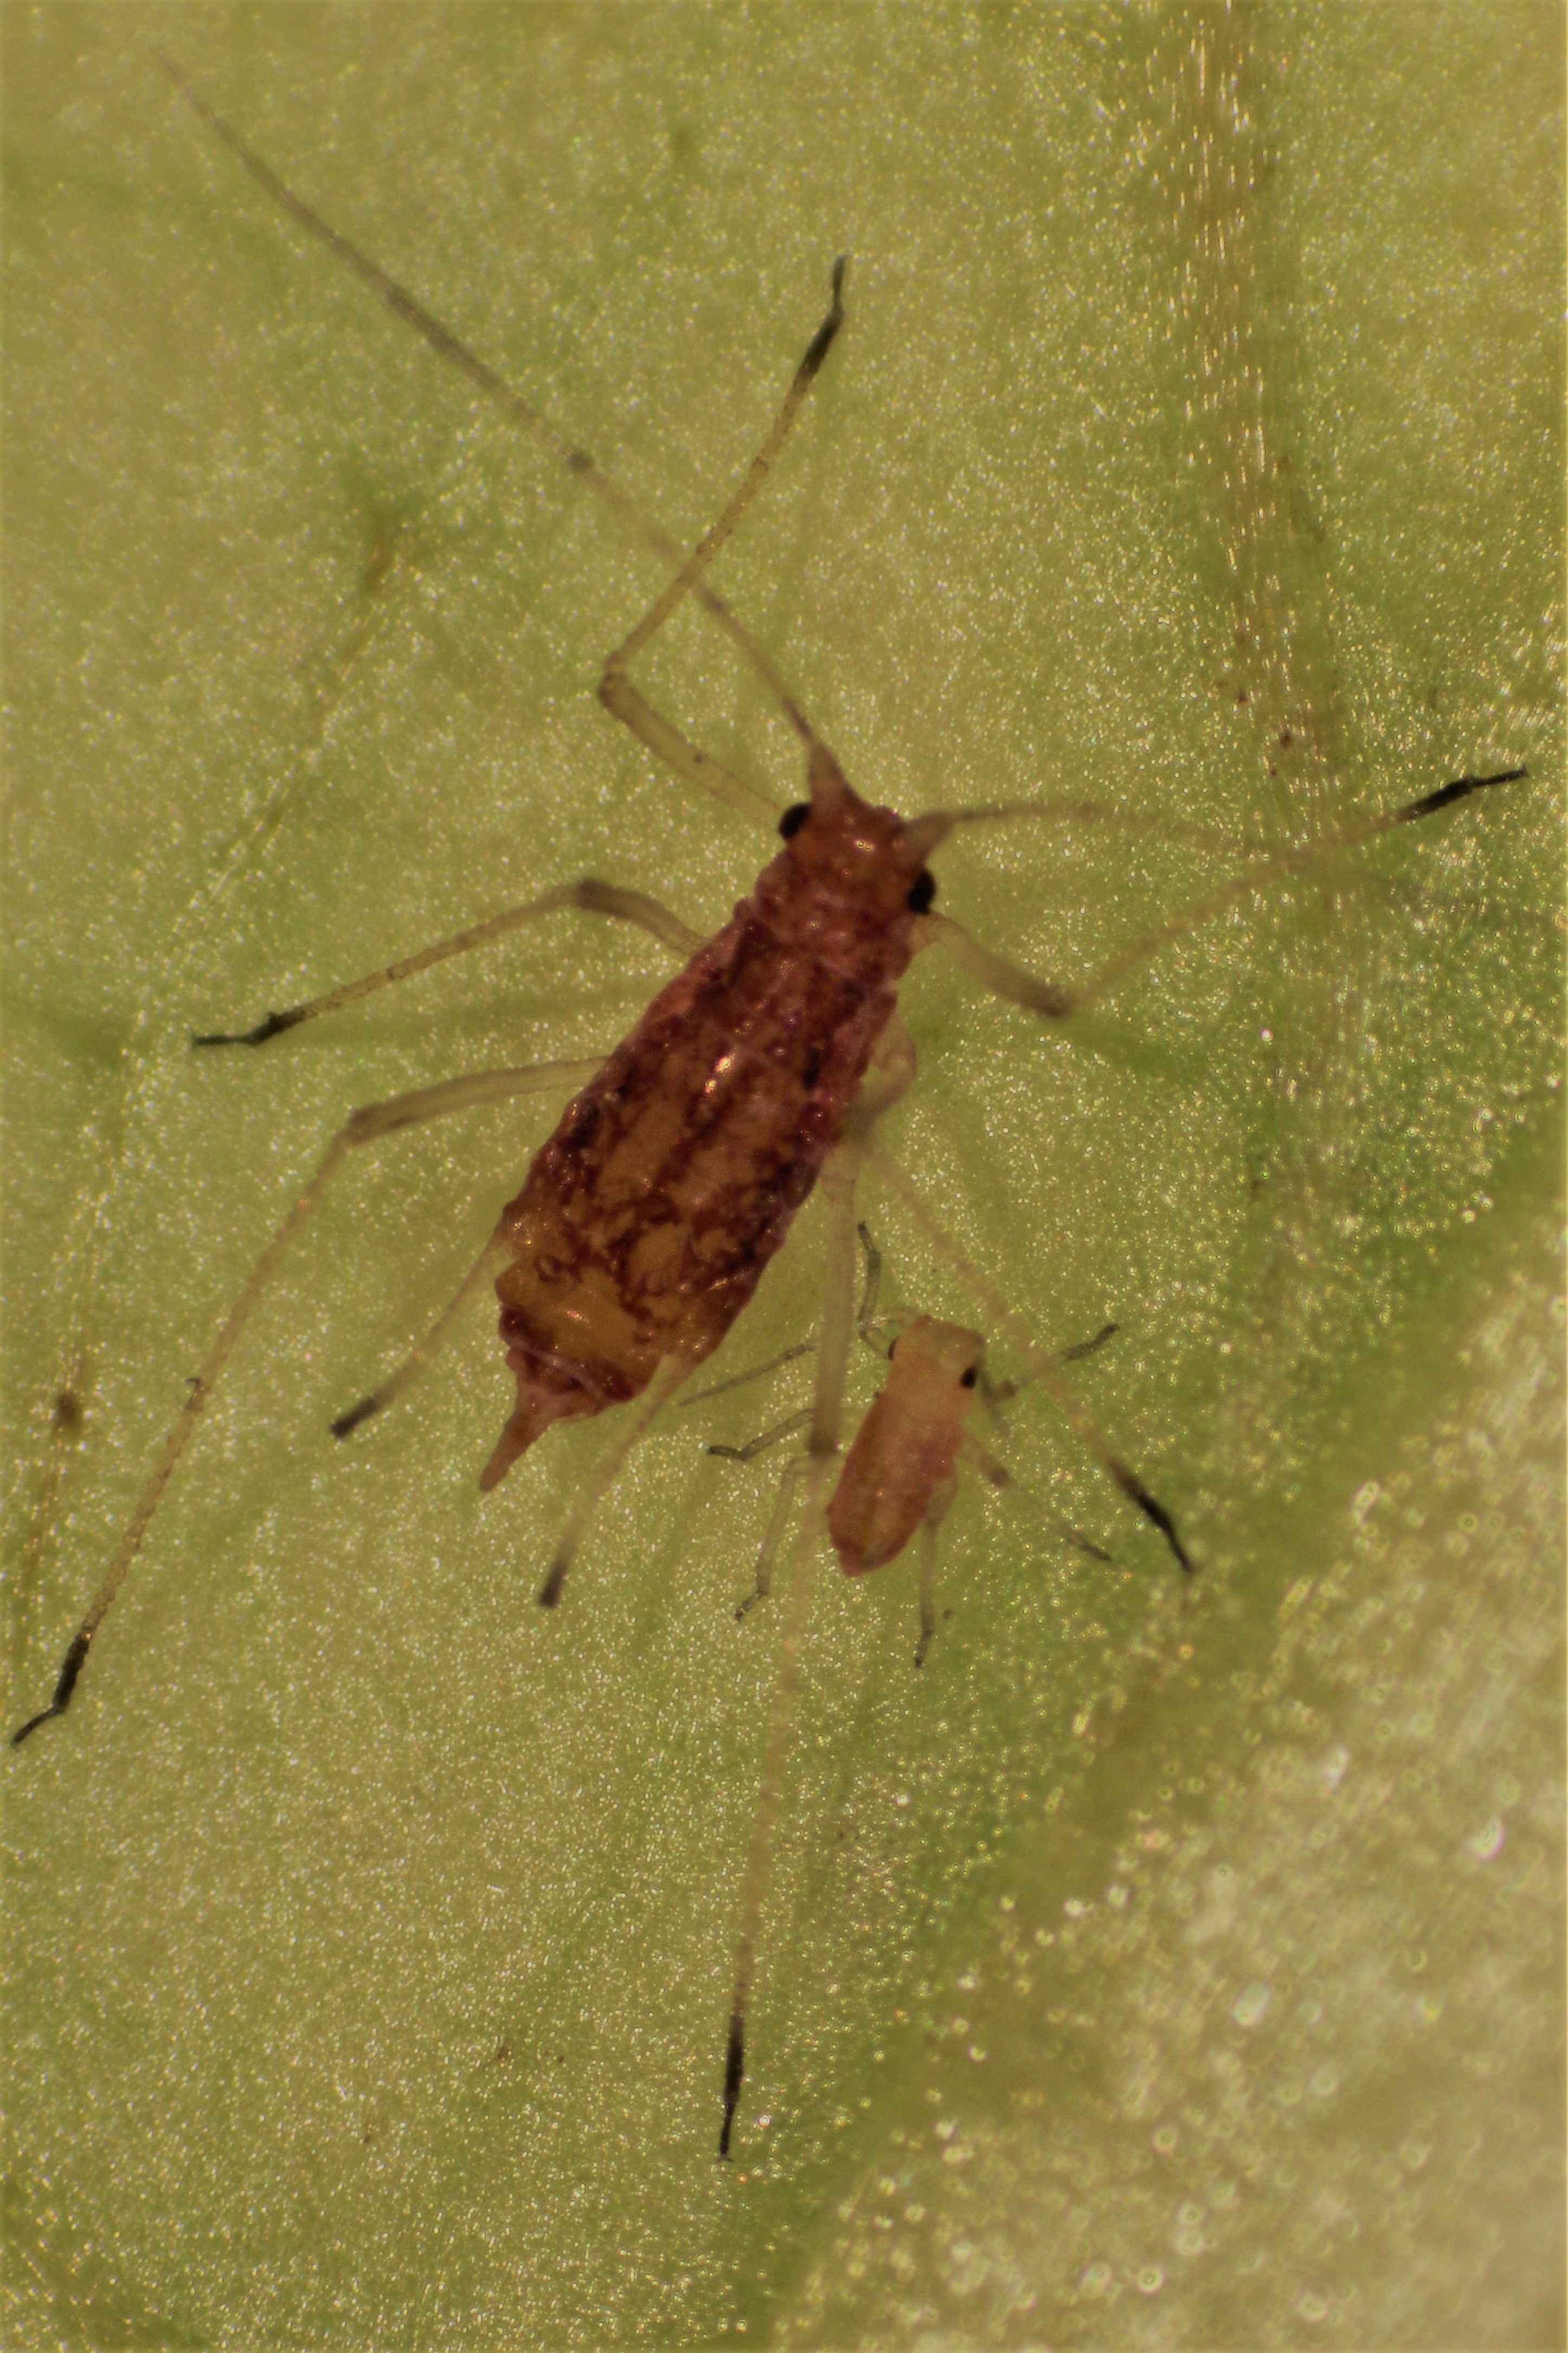
    Since last week, I have been receiving samples with “red” aphids to get the identification. It turned out that this time, most of these ‘reddish’ aphids were identified as the lettuce aphid, Nasonovia ribis-nigri (Fig. 1). To me, they look more red-orange; however, their distinct black marks on the abdomen and short cauda (finger-like, short appendage at the end of the abdomen) are some key ID features. These features help to differentiate the lettuce aphid from the other “red” aphid, the potato aphid Macrosiphum euphorbiae (Fig. 2). Yes, we do have two different species of red aphids!

    More samples for aphid ID are still coming into the UC Cooperative Extension office. The pattern is still similar to last week. There are mostly lettuce aphids on the submitted samples. I was also able to notice that some samples have mixed populations between the lettuce and the potato aphids, where all the specimens were red.

    We have several trial locations where we are scouting for aphids. So far, fields in Soledad have the largest number of aphids documented, as both alates (with wings, collected from yellow sticky cards) and wingless (collected from lettuce samples). If you need further information about the other scouting locations, or would like to double check your aphid ID, please contact or send samples to Alejandro Del-Pozo (adelpozo@ucanr.edu, 831-759-7359).