Tag: USDA Foreign Agricultural Service

  • USDA Accepting Applications for a Trade Mission to Singapore

    The USDA Foreign Agricultural Service (FAS) announced it is now accepting applications for its upcoming trade mission to Singapore, scheduled for Dec. 7 to 9.

    FAS Agribusiness Trade Missions directly connect American agribusinesses with overseas buyers, expanding market access and boosting exports for U.S. producers. Current and potential U.S. exporters interested in exploring trade opportunities in Singapore, Malaysia and Thailand must submit their application via the official online form by 11:59 p.m. EST, Sept. 8, 2026.

    “Expanding our footprint in Southeast Asia is critical as we work to diversify export opportunities and build new, resilient paths for getting safe, high-quality American agricultural products into more markets,” said Under Secretary for Trade and Foreign Agricultural Affairs Luke J. Lindberg. “Getting producers face-to-face with buyers cultivates long-term trade relationships in vibrant, rapidly developing markets—ensuring our producers have multiple avenues to meet global demand instead of relying on a single buyer.”

    In 2025, U.S. agricultural product exports to Singapore, Malaysia and Thailand reached more than $3 billion in total. This regional total includes $1.3 billion to Thailand and $1 billion to Malaysia. In Singapore, U.S. exports reached $769 million, with consumer-oriented products— such as tree nuts, dairy products, wine and processed foods—making up 65% of that value.

    In addition to brokering business-to-business meetings, FAS staff and regional experts will hold in-depth market briefings and host site visits and networking events to strengthen trade relationships throughout the mission.

    USDA anticipates significant growth opportunities in the region for several product categories, including:

    • Tree nuts
    • Food preparations, such as baking ingredients
    • Seafood
    • Beef
    • Wine and distilled spirits
    • Processed fruits and vegetables
    • Dairy, eggs and egg products
    • Pet food
    • Pulses, such as dry yellow and green split peas

    In 2025, USDA trade missions connected more than 250 U.S. companies with buyers in Hong Kong, Thailand, Peru, Guatemala, the Dominican Republic, Taiwan and Mexico, generating projected 12‑month sales of $125 million.

    Singapore will be USDA’s final Agribusiness Trade Mission for 2026—a year in which USDA sent delegations to Malaysia, Indonesia, Guatemala, El Salvador, the Philippines, Vietnam, Argentina, and Ecuador. USDA will announce 2027 missions soon.

    For information on these and other trade missions, visit https://www.fas.usda.gov/topics/trade-missions.

  • Brazil Sees Reduced Stone Fruit Yields

    The 2025/26 stone fruit growing season faced significant weather challenges, as late frosts and excessive rainfall in southern producing regions reduced yields. With modest export volumes, most stone fruit production is consumed domestically. The sector confronts volatile weather conditions, high production costs, and competition from imports, but benefits from government support programs and ongoing investments in orchard modernization.

    The Brazilian stone fruit sector focuses primarily on peaches, with some plum and nectarine production.

    Brazil is the 16th largest global peach producer, according to 2024 FAO (The Food and Agriculture Organization), with average annual production of 200,000 metric tons (MT). Main varieties include Chimarrita, Eldorado, Dourado-2, and Maciel, selected for adaptation to subtropical conditions and early harvest. The sector is fragmented and dominated by small and medium producers.

    While the Brazilian Institute of Geography and Statistics (IBGE) reported 4,735 peach-producing establishments in 2017 (most recent data available), industry contacts indicate this number likely decreased sharply by 2026, reflecting significant consolidation.

    Despite this contraction, peaches remain easily marketable and command premium prices in the Brazilian market. Technological advances have improved production efficiency. Some producers registered with the Brazilian National Registry of Seeds and Seedlings (RENASEM) now propagate varieties commercially, with certain operations working under royalty agreements to distribute improved cultivars.
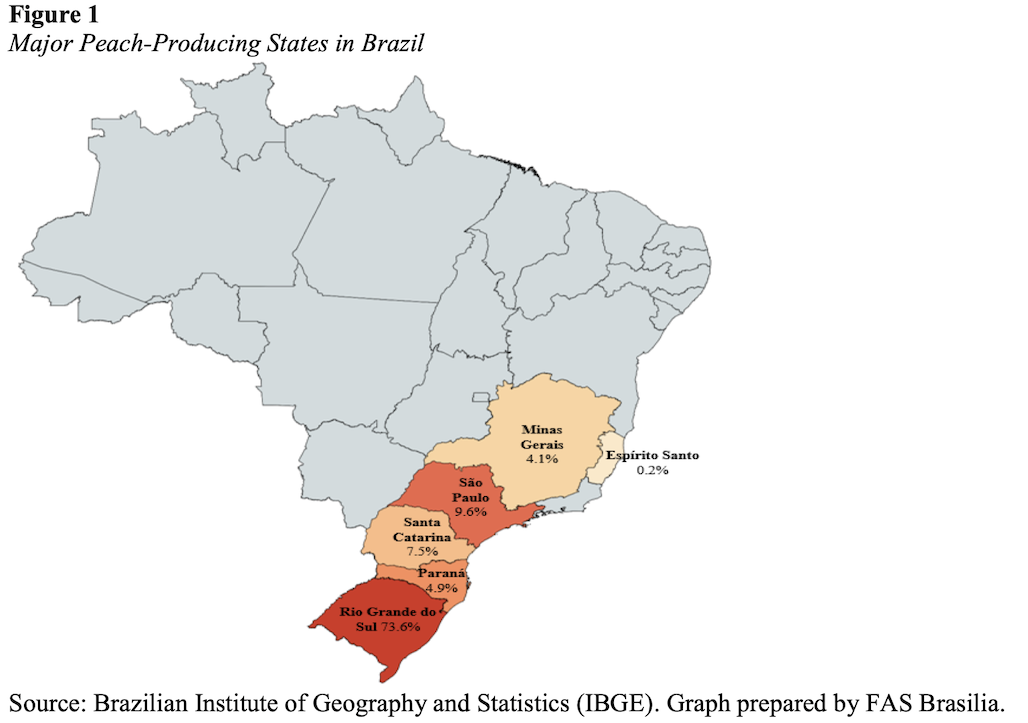
    Peach cultivation is a significant agricultural activity in the southern and southeastern regions of Brazil. The state of Rio Grande do Sul is the largest producer of peaches, with the city of Pelotas as the main city for both fresh and processed peach production.

    Brazil’s peach production has evolved significantly through genetic improvement programs led by the Temperate Agriculture branch of Embrapa, Brazil’s Agricultural Research Corporation (Embrapa Clima Temperado), which plays a key role in developing peach cultivars adapted to local conditions.

    Since 1975, Embrapa Clima Temperado has developed 32 cultivars, particularly for canning peaches, including nine major varieties – Esmeralda, Granada, Maciel, Santa Áurea, Jade, Sensação, BRS Citrino, BRS Bonão, and Eldorado – that offer superior fruit size, firmness, appearance, and productivity. These innovations include dual-purpose cultivars for both canning and fresh consumption, low-chilling varieties adapted to subtropical conditions, and improved disease resistance with reduced fruit development periods. One notable example is BRS Sarau, launched in 2023, which extends the harvest season for fresh consumption.

    While the Southern region remains Brazil’s largest producer, much of this production targets the industrial sector (canned, dehydrated products). Other regions, including São Paulo state, focus on fresh fruit production, which requires different management techniques including specialized pruning, thinning, and cultivation practices to achieve optimal color and flavor.

    Production shifted from manual to automated processing, with industry estimating that one pit removal machines now replace the work of 40 workers each. Modern operations employ sorting machines, automated packaging equipment, and harvesting techniques processing 12-15 tons daily, alongside enhanced nutritional management using efficient fertilizers that improve shelf life and fruit quality.

    Despite technological advances, the sector faces significant challenges including labor shortages and pest management issues. The 2016 San José Scale outbreak – insects that withdraw nutrients from the tree – required 60 percent replanting after causing trees to abort fruit formation, though producers have since developed management expertise. Other threats include fruit flies, Oriental Fruit Moth controlled through pheromone traps, and Monilinia fructicola which causes brown rot in humid zones. Southern Embrapa maintains an alert system with trap monitoring and regular meetings covering pest management and orchard fertilization, while biological control research offers promise for future improvements.

    In 2025, Rio Grande do Sul produced 45-46 million cans of peaches, representing over 95 percent of Brazil’s canning peach production. The Pelotas microregion directed approximately 90 percent of its peach output to the canning industry.

    While nearly 100 factories historically operated in the region, only about 11 industrial facilities remain operational. Small-scale peach juice and pulp production exists but remains limited, with the major juice industry in Espírito Santo relying on imported pulp.

    According to Post contacts in Rio Grande do Sul, several producers traded peach cultivation for soybeans or tobacco, which offer more comprehensive technical assistance and insurance coverage. Labor shortages are driving investments in electric or automatic pruning equipment.

    Read the full USDA Foreign Ag Service here. — Story by Carolina Castro, USDA Foreign Ag Service

  • U.S. Participants for Philippines Trade Mission Selected

    The U.S. Department of Agriculture will lead a trade mission to Manila, Philippines, from April 13–16, 2026, to expand market access for American farmers, ranchers, and producers.

    This mission follows a landmark trade agreement negotiated by President Trump in July of last year, which opened new opportunities for U.S. agricultural exports to the Philippines. Deputy Under Secretary for Trade and Foreign Agricultural Affairs Michelle Bekkering will lead the mission, heading a delegation of 58 U.S. agribusinesses, trade associations, and representatives from four State departments of agriculture.

    “USDA is committed to getting American farmers, ranchers and agribusinesses better access to strong markets and fair opportunities abroad,” said Deputy Undersecretary Bekkering. “Since the Philippines is one of the fastest-growing markets in Asia, this mission will connect U.S. exporters directly with reliable buyers, strengthen our trade relationship, and help keep American agriculture globally competitive.”

    The Philippines is the tenth‑largest market for U.S. agricultural and food products, averaging $3.4 billion in annual exports over the past five years. With a population of 118 million, a rapidly expanding middle class, and strong consumer preference for U.S. products, the Philippines offers enormous growth potential for American exporters.

    During the visit, USDA’s Foreign Agricultural Service staff and regional experts will host market briefings, site visits, and business-to-business meetings with buyers from the Philippines.

    State departments of agriculture from Idaho, Kansas, Nebraska and Wisconsin will join the mission alongside the 58 agribusinesses and trade associations, which include:

    1. 7th Sky Ventures LLC – Tampa, Fla.
    2. Aerocos International Ltd – Marlboro, N.J.
    3. American Egg Board Chicago, Ill.
    4. American Peanut Council – Alexandria, Va.
    5. Best Buy Grocers, Inc. – Sherman Oaks, Calif.
    6. BNutty, Peanut Butter Portage, Ind.
    7. California Milk Advisory Board – Tracy, Calif.   
    8. California Table Grape Commission – Fresno, Calif.
    9. CAS InterGlobal – Pleasanton, Calif.
    10. Commercial Creamery Company Spokane, Wash.
    11. Dairy Farmers of Wisconsin Madison, Wis.
    12. Dragonfly Cakes Tacoma, Wash.
    13. East-West International Group, Inc   Moreland Hills, Ohio.
    14. Foodlinx – Brentwood, Calif.
    15. Fort McCoy Meat, LLC Fort McCoy, Fla.
    16. Galdisa USA – Conroe, Texas
    17. Global Export Marketing Co. Ltd. (GEMCO) New York, N.Y.
    18. Globex International – New York, N.Y.
    19. Groceries USA – New York, N.Y.
    20. Grove Services Atlanta, Ga.
    21. Indiana Corn Marketing Council Indianapolis, Ind.
    22. International Market Brands Issaquah, Wash.
    23. Intervision Foods Atlanta, Ga.
    24. Jack’s Alimentary Supply, Inc. (JASI) Lowell, Mass.
    25. Kizable, LLC – Fort Lauderdale, Fla.
    26. MacDonald Meat – Seattle, Wash.
    27. MEM Fairway Inc. – Irvine, Calif.
    28. Nebraska Corn Board – Lincoln, Neb.
    29. North American Export Grain Association Washington, D.C.
    30. Ocean Gold Seafoods Westport, Wash.
    31. Pacific Cheese Co., Inc. – Hayward, Calif.
    32. PacRim Wines & Spirits San Rafael, Calif.
    33. Potatoes USA – Denver, Colo.
    34. Prime Pecan, LLC – Ocean Springs, Miss.
    35. Raisin Administrative Committee – Fresno, Calif.
    36. Scout & Zoe’s Anderson, Ind.
    37. Sollarom Foods – Lakewood, Calif.
    38. Southern Forest Products Association Metairie, La.
    39. Space Enterprises LLC – The Woodlands, Texas
    40. TAG Enterprise Ltd. Beverly Hills, Calif.
    41. Tomex Foods Group Lombard, Ill.
    42. Tranect LLC Boston, Mass.
    43. Trinity Foods, Inc – San Diego, Calif.
    44. U.S. Dairy Export Council – Arlington, Va.
    45. U.S. Grains & BioProducts Council – Washington, D.C.
    46. U.S. Highbush Blueberry Council – Folson, Calif.
    47. U.S. International Foods LLC – St. Louis, Mo.
    48. U.S. Livestock Genetics Export – Mount Horeb, Wis.
    49. U.S. Meat Export Federation – Denver, Colo.
    50. U.S. Soybean Export Council – Chesterfield, Mo.
    51. U.S. Wheat Associates – Arlington, Va.
    52. United Dairy Ingredients Group LLC – Monterey Park, Calif.
    53. US Rice Producers Association – Katy, Texas   
    54. USA Poultry and Egg Export Council – Tucker, Ga.
    55. USA Pulses – Moscow, Idaho
    56. Valley Pride Ag Co. Fresno, Calif.
    57. Virginia Distillery Co. – Lovingston, Va.
    58. Wonderful Citrus Delano, Calif.

    In 2025, USDA trade missions connected more than 200 U.S. companies with buyers in Hong Kong, Thailand, Peru, Guatemala, the Dominican Republic, Taiwan and Mexico, generating projected 12‑month sales of $125 million. USDA will continue expanding export opportunities in 2026 with upcoming missions planned for Australia and Vietnam.

    For more information on USDA trade missions, visit https://www.fas.usda.gov/topics/trade-missions. — By USDA Foreign Ag Service

  • USDA Launches TRUMP Mission to Vietnam to Expand Market Access for American Farmer

    The U.S. Department of Agriculture launched a Trade Reciprocity for U.S. Manufacturers and Producers (TRUMP) Mission to Vietnam this week to open new markets, strengthen export opportunities, and secure fair, reciprocal trade for American farmers, ranchers and producers.

    Under Secretary for Trade and Foreign Agricultural Affairs Luke J. Lindberg is leading a delegation representing a cross-section of American agriculture that stands to benefit from expanded access to one of Asia’s fastest-growing markets.

    “American farmers, ranchers and producers thrive when they have strong, reliable markets for their high-quality products,” said Under Secretary Lindberg. “By strengthening our trade relationship with Vietnam, we’re opening doors for U.S. agriculture, ensuring they have a fair chance to compete and succeed, and that they can bring the benefits of that success to communities here at home.”

    Vietnam has become a top destination for U.S. agricultural products. In 2025 alone, agriculture, fishery and forest products exports surged by 45% to a record $5.6 billion, making Vietnam the United States’ eighth-largest market. This mission will build on that momentum by expanding market access, connecting suppliers with new buyers, and advancing negotiations under President Trump’s strategy to deliver fair, enforceable trade for American farmers and ranchers.

    During the visit, USDA’s Foreign Agricultural Service will lead industry tours, host business meetings, and engage with Vietnamese officials to advance U.S. trade priorities and support U.S. producers. The delegation includes:

    1. California Fresh Fruit Association – Fresno, Calif.
    2. California Prune Board – Roseville, Calif.
    3. Potatoes USA – Denver, Colo.
    4. USA Poultry & Egg Export Council – Tucker, Ga.
    5. U.S. Dairy Export Council – Arlington, Va.
    6. U.S. Grains and Bioproducts Council – Washington, D.C.
    7. U.S. Meat Export Federation – Denver, Colo.
    8. U.S. Soybean Export Council – Chesterfield, Mo.
    9. U.S. Wheat Associates – Arlington, Va.
    10. Washington Apple Commission Wenatchee, Wash.

    This is USDA’s third TRUMP mission of 2026. Later this year, USDA will return to Vietnam with a broader agribusiness trade mission to continue expanding opportunities for U.S. food and agricultural exports.

    For more information on USDA trade missions, visit https://www.fas.usda.gov/topics/trade-missions. — By the USDA Foreign Ag Service

  • Mexico Leads Avocado Production

    Mexico continues to lead the world in avocado production. For 2026, Post forecasts Mexican avocado production to increase by 3% to 2.8 million metric tons (MMT). This is mainly a result of favorable growing conditions and sustained export demand. Mexican avocado exports are forecast to increase 7% to 1.3 MMT, with the United States remaining Mexico’s top destination for avocado exports.

    Production

    Post forecasts Mexican avocado production in calendar year (CY) 2026 at 2.80 MMT, a 3% increase from 2025. This growth is mainly a result of improved agricultural practices, favorable early-season rains and cooler conditions, and sustained export demand. Planted area is forecast to remain flat at approximately 268,000 hectares. Mexico’s avocado sector remains the global leader in production, with an estimated 28% of global production.

    While roughly 65% of orchards still rely on seasonal rainfall, producers are rapidly accelerating the adoption of pressurized irrigation. This increase in installations of high-efficiency irrigation systems is allowing producers, mainly in Michoacan and Jalisco, to strengthen water management and tree nutrition.

    Favorable climate conditions in 2025 are also helping to drive an increase in production in 2026. The 2025 rainy season was characterized by a late-quarter extension, where significant rainfall through November 2025 and into early December 2025 recharged critical volcanic aquifers. This late-season moisture, combined with mild temperatures (68°F – 73°F) in December, provided the ideal conditions for blooming. This resulted in exceptional fruit retention and allowed the crop to trend toward larger, higher-value sizes. A potential “El Niño” (expected for the second part of CY 2026) could bring drier than average conditions and heat spikes that could decrease fruit sizes.

    The Hass variety continues to dominate all commercial production due to its post-harvest durability and high consumer preference. After a 2024 cycle marked by smaller fruit sizes due to heat stress, the 2025 crop shows a marked recovery in quality and caliber. Producers are reporting a return to more retail-friendly weights, with a high availability of 40s and 48s (ranging from 9 to 12 ounces).

    Mexico produces avocados in 30 out of the 32 states in the country. However, Michoacan and Jalisco are the highest producing states, with 85%  of production in volume, and are the only states authorized to export to the United States. Remaining production in the other states is focused on the national market and niche international destinations. Michoacan remains the heart of production, situated within the Trans-Mexican Volcanic Belt, where rich, well-draining volcanic soil covers approximately 80 percent of the total planted area.

    Post estimates Mexican avocado production for CY 2025 at 2.73 MMT, a 2% increase from 2024. High summer temperatures and drought conditions in 2024 hit the avocado production area in Michoacan and Jalisco. CY 2025 started slow, but volumes recovered given an improvement in climate conditions and a strong rainy season in Mexico.

    Read the full USDA FAS report hereUSDA Foreign Ag Service Staff

  • Australian Stone Fruit Production Picks Up, Recovers Post-Pandemic

    Stone fruit production in Australia is forecast to increase in marketing year (MY) 2022/23, following a MY 2021/22 season that was impacted by a shortage of labor supply at harvest, export freight logistical challenges borne about by the COVID-19 pandemic, and wet weather at harvest. Cherry production is forecast to increase by 19 percent, and peaches and nectarines by 13 percent. The export freight challenges are expected to continue to impact the forecast MY 2022/23 season and labor shortages are expected to continue, but to a lesser degree than the previous year.

    Increases in production, supported with an expectation of an improvement in labor availability for harvest, are anticipated to result in an increase in exports of cherries by 15 percent and 25 percent for peaches and nectarines. Despite the limited availability of air freight and escalation in costs, almost all of the cherries exported in MY 2021/22 were by air and this is expected to continue into the forecast year. The overall forecast rise of peach and nectarine exports is mainly due to the anticipated production increase. If not for the continued labor availability and air and sea freight challenges, a larger rise in exports may be expected.

    Nectarine exporters during the first year of COVID-19 had adjusted to the lack of air freight in MY 2020/21 via a focus on increasing sea freight from around 50 percent in the prior years to 75 percent. However, with a recovery in air routes, air freight of nectarines increased in volume to 39 percent in MY 2021/22 and is likely to continue to rise if air freight logistics improve during harvest. For peaches, which are of lower value than cherries but also dependent upon air freight, export volumes in recent years have been less than half that of nectarines, and no significant improvement in their export volume is anticipated until there is an easing of air freight costs.  Read the full report from the USDA Foreign Agricultural Service HERE.

  • Imports and Production from Mexican Tomato Industry Remain Strong

    Assuming normal conditions for open-field cultivation and continued growth in the sector’s use of greenhouse and shade technologies, Mexico’s fresh tomato production for October-September marketing year (MY) 2022/23 is projected to match the official production estimate for MY 2021/22 of 3.7 million metric tons (MMT). Despite abnormally dry conditions in some areas, no major production shortfalls due to weather are present at this time. The largest producing state remains Sinaloa with 23 percent of total production, followed by San Luis Potosi, Michoacan, Baja California Sur, Zacatecas, Morelos, Puebla, and Jalisco. To obtain higher yields, Mexican growers continue to transition from open field towards more controlled production under protected cultivation methods. Exports to the United States will also remain strong due to available exportable supply and flat domestic consumption.

    Production

    In MY 2022/23, Mexico’s tomato sector is expected to maintain its current productivity, assuming normal growing conditions and continued strong demand from the U.S. market, with Post projecting production will remain at 3.7 MMT. Tomatoes are grown across Mexico throughout the year with two important production/harvest peaks that overlap: from December to April with fruit from the state of Sinaloa, Mexico`s largest tomato producer, dominating the domestic market and exports to the United States; and from May to November the major suppliers in order of supply are San Luis Potosi followed by Michoacan, Baja California Sur, Zacatecas, Morelos, Puebla, and Jalisco. At the time of this report, production for MY 2021/22 is estimated to be 3.72 MMT based upon higher yields as the sector continues to expand in the greenhouse and other technological methods of production. This is occurring in both current major producing areas as well as lower volume states. The official production figure for MY 2020/21 is 3.03 MMT, according to Mexico’s Agrifood and Fisheries Information Service (SIAP). In MY 2020/21, Sinaloa produced over 709,000 MT followed by San Luis Potosi with 343,670 MT, Michoacan with 237,841 MT, Baja California Sur with 164,507 MT, and Zacatecas with 158,970 MT. For production share of major producing states in 2021 see Figure 1 below.

    According to available data from SIAP, Sinaloa remains the leading supplier of tomatoes followed by San Luis Potosi and Michoacan. These top three producing states account for over forty percent of national production, but tomatoes are grown throughout the country. For production history of the top five producing states see Figure 2 below. While Sinaloa remains the largest producer in Mexico at the state level, the majority of growth in Mexico’s national production is dispersed across San Luis Potosi, Michoacan and other smaller producing states.

    The use of different levels of technology for protected agriculture production allows Mexican growers to supply the U.S. market year-round. Greenhouse, shade houses, and high tunnel systems are in use throughout the country. According to available data, in 2010, Mexico’s production from these systems was less than 1.0 MMT. By 2012, tomatoes cultivated from these protected methods reached 1.61 MMT. This ongoing trend is due to a combination of open-field production converting to various shade and tunnel methods, as well as most new production being in the form of greenhouse, shade, and tunnel cultivation. From 2012 to the present day, non-open-field production has become an increasingly important share of national production, and accounts for most of the sector’s growth. By 2020/21, tomato production from protected sources reached an estimated 2.21 MMT, accounting for 67 percent of total tomato production. Figure 3 below shows this progression in which open-field production has become a smaller share of Mexico’s production.

    While Mexico’s domestic consumption of fresh tomatoes is not covered in depth by this report, understanding basic national attributes helps to inform trends in production and trade. Mexico exports over half of its annual production. Based upon available population and per capita consumption data, Mexico’s annual tomato consumption stands at approximately 1.75 MMT. In 2021, the Secretariat of Agriculture and Rural Development (SADER) estimated annual per capita consumption of tomatoes in Mexico at 13.4 kg/person.

    Trade

    In MY 2022/23, Post forecasts Mexico’s fresh tomato exports at 1.9 MMT due to expected rising supply, limited growth in domestic consumption, and robust U.S. demand. Mexico continues to be the largest supplier of fresh tomatoes to the United States, and is the world’s largest exporter of fresh tomatoes as a result. Based upon available data and pace of trade, post estimates exports for 2021/22 to reach 1.7MMT, a marginal decrease from the year prior. Although exports to the United States are year- round and consistently above 100,000 MT per month, the largest volume of exports generally takes place from January to March (see Figure 4). In 2020/21, Mexico exported over 1.76 MMT of tomatoes to the United States, holding an estimated 91 percent market share, with Canada and several other Latin American suppliers exporting a much smaller quantity. Likewise, the United States absorbs nearly all of Mexico’s exportable supply of fresh tomatoes. Mexican imports of fresh tomatoes are negligible, totaling just 640 MT in MY 2020/21.

    Mexican tomatoes follow well-established supply chains to markets throughout the United States. The greatest volume of Mexican tomatoes enter through the Laredo customs district, followed by the Nogales and San Diego customs districts. The reader should note that the Laredo district has four important ports of entry (POE) for the crossing of tomato shipments. In order of volume, these are: Pharr, Laredo, Brownsville, and Progreso. In comparison, the Nogales customs district consists of one crossing POE for tomatoes, as does the San Diego district. For the share of tomato exports by Customs District see Figure 5 below. Once processed and cleared by U.S. authorities, specialized wholesalers redistribute product to retail chain distribution centers further north in the United States. Product

    crossing through the Laredo POE typically reach distribution centers further north in Texas to be consolidated with other goods and distributed to points of sale.

    Policy

    The Tomato Suspension Agreement (TSA) of fresh tomatoes grown in Mexico ensures that signatory producers and exporters sell all fresh and chilled tomatoes to the United States at or above the TSA reference price. Tomatoes for processing are exempt from the reference price. Tomato shipments are inspected upon entry for compliance with existing U.S. import regulations by agencies including Customs and Border Protection (CBP), United States Department of Agriculture (USDA), and the Food and Drug Administration (FDA). The reader should be cognizant that the TSA is different from import requirements of fresh tomatoes under Section 8e of the USDA Agricultural Marketing Agreement Act of 1937 (AMAA). Also, tomatoes are inspected at U.S. ports of entry by CBP and USDA to ensure product is free of evidence of Tomato brown rugose fruit virus (ToBRFV), and are also subject to FDA inspection. — By Eduardo Lozano, USDA Foreign Agricultural Service

  • Despite Production Challenges, Egypt to Continue as World’s Largest Fresh Orange Exporter

    The USDA Foreign Agricultural Service (FAS) in Cairo anticipates Egypt to maintain its position as the number one orange exporter in MY 2021/22 despite production challenges. In marketing year (MY) 2021/22, FAS Cairo forecasts fresh orange exports to reach 1.45 million metric tons (MMT) down from 1.67 MMT in MY 2020/21. Post attributes the decrease in exports to lower production amid unfavorable climate conditions. Russia, Saudi Arabia, Netherlands, India, Bangladesh, United Arab Emirates, China, United Kingdom, Ukraine, and Oman are likely to remain Egypt’s top ten export destinations for fresh oranges. 

    Planted Area:

    In MY 2021/22, FAS Cairo forecasts total planted area in oranges at 168,000 hectares (ha), similar to the previous marketing year. MY 2020/21 planted area at 168,000 ha remains unchanged from the USDA official estimate. Most of the area planted with oranges is located in desert reclaimed lands which account for 70 percent of the total area. Plantations in the Nile Delta region account for 30 percent of the total orange planted area.

    Post estimates MY 2021/22 total harvested area at 135,000 ha, a 6.9 percent decrease from last year. The decrease in area harvested is attributed to an approximately 7.2 percent decrease in the number of bearing trees from the previous year due to unfavorable weather conditions during flowering time that negatively impacted fruit set, and hence the harvest as a result.

    Production:

    In MY 2021/22, FAS Cairo forecasts orange production to decrease by almost 16 percent, or 570,000 MT to 3 MMT. The decrease in production is attributed to severe weather conditions and fluctuating temperatures during flowering of the trees which impacted fruit set and production. Orange production in the Nile Delta was also impacted by a 25-30 percent increase in fertilizer prices due to higher costs of production and larger exports by the fertilizer industry to capture higher prices in the global market. Typical land ownership in the Nile Delta is an acre or less.

    Post is also revising the MY 2020/21 estimate upwards by 170,000 MT to 3.57 MMT from the USDA official projection of 3.4 MMT. We attribute the increase in production to higher yields and favorable weather conditions last season during the flowering time that positively impacted fruit set and hence the production as a result.

    Most of Egypt’s orange production come from commercial farms on reclaimed desert land established during the last three decades, rather than the Nile Valley where land ownership is fragmented and farmers cannot afford the necessary level of investment for sustainable orange production. Despite these challenges, replacing old orchards with newer trees, improving on-farm irrigation techniques, adopting up-to date nutrient management programs, and reducing post-harvest losses are ongoing efforts by growers associations and the government.

    Orange is the major citrus crop in Egypt, representing about 80 percent of the total cultivated citrus area. Egypt’s main orange varieties include the following:

    Washington Navel Orange: Washington Navel is the key cultivar navel orange grown in Egypt and the best-known naval orange being exported. There are other lesser known navel orange cultivars such as Navelate, Cara Cara, New Hall, Navelina, Fisher, Leng, Fukumoto and Lane late. Fruit color break starts in late September and ripening fruit dates extend from November to March. The fruit is seedless, medium to large-sized, with relatively rough skin in some cultivar and soft skin in others. It has a sweet flavor with a fruit taste. The rind is orange with dark pulp.

    Valencia Orange: Valencia ranks second after Navel oranges as far as area cultivated. Nubaria district is considered the largest production area for Valencia oranges in Egypt. Valencias have a long ripening season from March to July. The fruit pulp is juicy and it is medium to large-sized with a round to oval shape. The skin is soft and easily peeled, the seeds are small, and the rind and flesh are orange.

    Other Varieties: There are other orange varieties like Baladi orange, Blood orange, Khalily orange, Yafawy oranges and Sweet orange. Cultivated areas of these varieties are small compared to Navel and Valencia orange, and they’re mainly consumed fresh or as juice.

    Consumption:

    In MY 2021/22, FAS Cairo forecasts that fresh oranges domestic consumption will decrease by 19.3 percent to reach 1.25 MMT. Decrease in local consumption is attributed to lower production and more growers directing their produce towards exports as worldwide orange demand is on the rise. Globally, consumers have increased their utilization of fresh oranges amid the COVID-19 pandemic due to its high vitamin C content.

    In MY 2021/22, utilization of oranges by the processing sector is forecast to decrease by approximately 14.3 percent from the previous marketing year as a result of the anticipated lower fresh orange production and higher costs of the processing sector production and transportation which is reflected in consumer prices. MY 2020/21 fresh domestic consumption and processing estimates remains unchanged from the USDA official estimate.

    Trade:

    In MY 2021/22, FAS Cairo forecasts orange exports to decrease by approximately 13.2 percent to reach 1.45 MMT. We attribute this decrease to anticipated lower production which will affect the export volume. FAS Cairo anticipates Egypt to maintain its position as the number one orange exporter in MY 2021/22, despite production challenges due to severe climate conditions.

    Post is revising upward the estimates of fresh orange exports in MY 2020/21 to 1.67 MMT from the USDA official estimate of 1.5 MMT.

    Post attributes this increase in exports to higher production, more growers linked to international markets and a rise in global prices amid increased consumer demand.

    The majority of orange exporters are producers and own packing facilities that are approved for export by the government. They also buy from local farmers if their production is not sufficient to meet their export obligations. Other exporters own packing facilities but do not produce oranges, and thus rely on local farmers. In these cases, the exporters are responsible for transporting the crop to their packing facilities.

    The Central Administration for Plant Quarantine (CAPQ) of the Ministry of Agriculture and Land Reclamation (MALR) and the Agricultural Export Council (AEC) have agreed to start the orange export season on December 15, 2021 for the MY 2021/22. The export season for oranges usually starts with shipments to the Arabian Gulf followed by Russia, Ukraine, and then to the European Union and East Asia.

    In MY 2020/21, Egyptian orange exports reached 111 countries compared to 104 countries in MY 2019/20 with Russia, Saudi Arabia, Netherlands, India, Bangladesh, United Arab Emirates, China, United Kingdom, Ukraine, and Oman as Egypt’s top ten export destinations for oranges. Post expects that the top ten export destinations in MY 2021/22 will remain unchanged from MY 2020/21 (Figure 1).

    Figure 1: Top Ten Markets for Egypt’s Fresh Orange Exports

    Successful joint efforts by the Egyptian government and the private sector to open new markets such as New Zealand, Brazil, and Japan and other markets over the last few years will increase orange exports. These joint efforts have also contributed to the application of a modernized tracking systems for oranges exports during the stages of cultivation, production, packaging and export.

    The success of Egypt’s export policy in opening new markets and establishing a traceability system have contributed to Egypt being the top orange exporter in the world during the past 5 years with a total volume of 8.32 MMT. All of these developments support a positive outlook for Egyptian orange exports as well as encouraging agribusinesses to invest in establishing new facilities or expanding capacity.

    Egypt’s exports of fresh oranges to its top ten destinations in MY 2020/21 amounted to 1.27 MMT compared to 1.06 MMT in MY 2019/20, an increase of almost 20.5 percent. In MY 2020/21, Egypt’s fresh orange exports to the top ten destinations constituted 75 percent of total exports compared to 77 percent of total exports in MY 2019/20.

    Metric Tons

    This drop is due to a smaller overall export volume in MY 2019/20 (1.37 MMT) compared to 1.67 MMT of fresh orange exports in MY 2020/21. It is also reflected in higher export volumes to key markets as well as exploring new export ones.

    In MY 2020/21, the most significant increase in Egypt’s fresh orange exports were to India with a more than threefold increase compared to the previous marketing year due to higher demand by Indian consumers amid the COVID-19 pandemic. Exports to Bangladesh have also increased a great deal, by 75 percent. Exports to Russia increased by 15 percent and Egyptian orange exports to Saudi Arabia have also increased, by 6 percent. Exports to the Netherlands increased by 11 percent in MY 2020/21 compared to MY 2019/20.

    In contrast, Egyptian orange exports to the Chinese market dropped by roughly 32 percent in MY 2020/21 compared to the previous marketing year due to inflated freight prices.

    Marketing:

    Russia: Turkey and South Africa are Egypt’s main competitors in the Russian market. However, Egypt’s total exports to Russia in CY 2021 (Jan-Sep) was at 238,560 MT exceeding both origins by a wide margin South Africa at 36,929 MT and Turkey shipped 34,822 MT. Egypt’s total exports to Russia in CY 2020 was at 211,113 MT, also exceeding both origins by a wide margin Turkey at 112,353 MT and South Africa shipped 77,045 MT. (Source: Trade Data Monitor, LLC)

    Saudi Arabia: Egypt’s main competitors in the Saudi Arabian market are traditionally South Africa, Spain, and Lebanon. In CY 2021 (Jan-Sep), Egypt’s exports of fresh oranges to the Saudi Arabian market amounted to 245,569 MT exceeding the three origins by wide margins. South African exports amounted to 61,740 MT, Spain’s exports at 10,788 MT, followed by Lebanese fresh orange exports at 8,380 MT. In CY 2020, Egypt was also the leading exporter to Saudi Arabia with a total of 254,486 MT versus 89,373 MT exported by South Africa. followed by Lebanon at 24,358 MT, and Spain at 15,348 MT. (Source: Trade Data Monitor, LLC)

    EU- 28: Egypt’s main competitors in the European Union are South Africa and Morocco. In CY 2020, South Africa exported 453,745 MT versus 211,697 MT exported by Egypt followed by Morocco at 74,864 MT. In CY 2021 (Jan-Aug), Egypt’s exports of fresh oranges to the European Union have increased by 22 percent compared to the same period in CY 2020 amounting to 308,384 MT, and exceeding South Africa which shipped 158,932 followed by Morocco at 45,454 MT. (Source: Trade Data Monitor, LLC)

    India: South Africa is Egypt’s competitor in this market. In CY 2020, Egyptian exports amounted to 26,665 MT while South Africa supplied 11,000 MT to the Indian Market. In CY 2021 (Jan-Sep), Egypt’s exports of fresh oranges to India amounted to 126,271 MT exceeding the South African origin by wide margins. In CY 2021 (Jan-Sep), South Africa shipped only 12,179 MT to India. (Source: Trade Data Monitor, LLC).

    Bangladesh: Egypt’s main competitor in the Bangladeshi market are mainly India and South Africa. In CY 2021 (Jan-Sep), Egypt’s exports of fresh oranges to Bangladesh amounted to 107,000 MT, India at 62,531 MT and South African exports amounted to 40,127 MT. In CY 2020, India was the leading

    exporter to Bangladesh with a total of 127,914 MT versus 66,000 MT exported by South Africa and another 66,000 MT exported by Egypt. (Source: Trade Data Monitor, LLC)

    China: South Africa is Egypt’s main competitor in this market. In CY 2020, Egyptian exports to the Chinese market amounted to 112,373 MT while South Africa supplied 105,000 MT. In CY 2021 (Jan- Sep), Egypt’s exports of fresh oranges to the Chinese market amounted to 86,130 MT, and South African exports amounted to 66,861 MT. (Source: Trade Data Monitor, LLC)

    United Arab Emirates: In CY 2020, South Africa exported 89,527 MT versus 138,611 MT exported by Egypt. In CY 2021 (Jan-Aug), Egypt’s exports of fresh oranges to the UAE market amounted to 49,432 MT, and South African exports amounted to 76,420 MT (Source: Trade Data Monitor, LLC).

    United Kingdom: Egypt’s competitors in the UK market are mainly Spain and South Africa. In CY 2021 (Jan-Sep), Egypt’s exports of fresh oranges to the United Kingdom amounted to 64,000 MT, Spain at 66,000 MT, and South African exports amounted to 45,386 MT. In CY 2020, Spain was the leading exporter to the United Kingdom with a total of 93,500 MT versus 67,800 MT exported by South Africa, followed by Egypt which shipped 55,217 MT to the UK market. (Source: Trade Data Monitor, LLC)

    Ukraine: In CY 2020, Egyptian exports to Ukraine amounted to 41,600 MT while Turkey supplied 30,639 MT. In CY 2021 (Jan-Sep), Egypt’s exports of fresh oranges to the Ukrainian market amounted to 48,192 MT and Turkish exports amounted to 5,291 MT, a 70 percent decline compared to the same period in CY 2020. (Source: Trade Data Monitor, LLC)

    Oman: In CY 2020, Egypt exported 35,770 MT to Oman versus 13,171 MT exported by South Africa. In CY 2021 (Jan-Sep), Egypt’s exports of fresh oranges to Oman amounted to 35,000 MT, and South African exports amounted to 10,000 MT (Source: Trade Data Monitor, LLC). — By Ahmed Wally, USDA Foreign Agricultural Service

  • Challenges for the Japanese Citrus Market

    Japan’s mandarin production continues to decline amidst labor shortages and reduced consumption. Shipping challenges and rising prices are projected to reduce the consumption of largely imported oranges and grapefruit. FAS/Tokyo anticipates that the resumption of hotel and restaurant operations following 2020-2021 COVID-19-related states of emergency will support the recovery of the Japanese demand for fresh lemons.

    Production

    Japan’s domestic tangerine/mandarin production primarily focuses on Satsuma mandarins, also known as “Unshu mikan” or “Unshu orange” (referred to as “unshu” hereafter). After reaching peak production of 3.7 million metric tons (MT) and a corresponding price drop in 1975, Japan’s unshu production has been steadily declining in line with production plans by Japan’s Ministry of Agriculture, Forestry and Fisheries (MAFF). In response, some citrus farmers have transitioned to producing non-unshu varieties (e.g., Natsu-Mikan (Citrus natsudaidai) and Iyokan (Citrus Iyo)). Although this transition had partially offset falling unshu production, non-unshu production has also been declining since 1987 due to the overarching challenge in Japanese agriculture of aging farmers and a lack of successors.

    In marketing year (MY: October September) 2021/22, FAS/Tokyo forecasts area harvested for tangerines/mandarins in Japan will shrink by 1,300 hectares (ha) to 50,400 ha from MY 2020/21. The unshu varieties will represent approximately 80 percent of Japan’s total tangerine/mandarin production, and the remainder will be non-unshu varieties.

    Japan’s tangerine/mandarin season runs generally between October and May, where unshu production occurs primarily between October to February, followed by non-unshu varieties. According to MAFF statistics, five western prefectures (Wakayama, Ehime, Shizuoka, Kumamoto, and Nagasaki) produce nearly 70 percent of Japan’s unshu. These five prefectures are also major producers of non-unshu varieties. Until MY 2019/20, MAFF had set an “appropriate production/distribution quantity” target to control production, but recent unshu production fell short of the targets. Therefore, MAFF decided to shift away from government-driven production control. For MY 2021/22, MAFF announced a tangerine/mandarin demand estimate in an effort to balance production with market demand. 

    MAFF’s MY 2021/22 demand estimate for unshu is 760,000 MT, 6,000 MT down from MY 2020/21. However, based on industry sources, FAS/Tokyo forecasts Japan’s MY 2021/22 production will fall short of meeting that demand. According to Wakayama unshu farmers, MY 2021/22 will be an “offyear” for the alternatively bearing unshu in Wakayama and Shizuoka prefectures. Furthermore, long rains in May and August negatively impacted production due to increased incidence of Botrytis cinerea and citrus black spot disease. FAS/Tokyo forecasts MY 2021/22 tangerine/mandarin production at 924,000 MT, down 5.3 percent from MY 2020/21 level, of which 720,000 MT will be unshu.

    Consumption

    Approximately 90 percent of domestically produced tangerines/mandarins are consumed fresh in Japan. The remainder is processed, mostly for juice. According to surveys carried out by the Japan Fruit Association (JFA) and the Japan Co-operative Alliance (JCA), price is increasingly the key consideration for Japanese consumers in purchasing fresh fruit. For example, the 2020 JFA survey found that approximately 55 percent of Japanese consumers eat fresh fruit less than once a week due to cost. Although at-home food consumption, where tangerines/mandarins are typically eaten, has increased during the COVID-19 pandemic, this trend has not led to an increase in fresh fruit consumption. Consequently and in light of the expected decline in domestic tangerine/mandarin production, FAS/Tokyo forecasts Japan’s total tangerine/mandarin consumption will decrease by 5.0 percent from MY 2020/21 to 949,000 MT in MY 2021/22.

    Imports

    In MY 2020/21, Japan’s imports of fresh tangerines/mandarins rose by 9.9 percent to 23,103 MT, primarily due to summer tangerine imports from Peru (Table 1), which gained market access to Japan for tangerines/mandarins in 2018. Although Peruvian tangerines are typically more price-competitive than U.S. or Australian products, there is minimal overlap or direct competition in the Japanese market between tangerine/mandarin imports from the United States and southern hemisphere. Nevertheless, despite remaining the top fresh tangerine/mandarin supplier to Japan, the U.S. import share has been declining in the last few years due to changing production patterns and export priorities in the United States, as well as increasing price (Table 1).

    FAS/Japan forecasts Japan’s imports of tangerines/mandarins to increase to 25,000 MT in MY 2021/22 or by 8.2 percent from MY 2020/21 levels, largely due to growing consumption in the summer months driven by the availability of Australian and Peruvian products.

    Exports

    Despite COVID-19-related restrictions on travel and promotional activities, Japan’s fresh tangerine/mandarin exports increased to 1,416 MT or by 34.4 percent from MY 2019/20 to MY 2020/21 largely due to greater demand from established customers in Hong Kong. Given the Government of Japan’s focus on boosting agricultural exports, including unshu (see JA2021-0103 titled “Japan Releases Details on Agricultural Export Expansion Plan”), FAS/Tokyo forecasts MY 2021/22 Japan’s tangerine/mandarin exports will grow to 1,800 MT or by 27 percent from MY 2020/21 levels.

    Policy

    U.S. tangerine/mandarin exports (Harmonized System Code (HS) 0805.21, clementines (HS 0805.22) and similar varieties (HS 0805.29)) continue to face a tariff disadvantage compared to tangerines/mandarins from member countries, including Australia and Peru, of the Comprehensive and Progressive Agreement for Trans-Pacific Partnership (CPTPP). The import tariff rate for CPTPP tangerines/mandarins is 5.6 percent, while U.S. products face a 17 percent tariff. Read the full report from the USDA Foreign Agricultural Service HERE.

  • Turkish Orange Crop Forecast Up 40%

    In Market Year (MY) 2021/22, the orange yield is forecast to increase 40 percent to 1.82 million metric tons (MMT) due to favorable rainy weather conditions in March and April 2021. The input costs for items such as fertilizer, fuel, and pesticides are still considered too high while farm gate prices are too low to compensate for the high production costs. Orange exports in MY 2021/22 are expected to increase 20 percent to 265,000 MT when compared with the previous season in correlation with high yield expectations. Tangerine exports in MY 2021/22 are expected to increase 11 percent to 1 MMT in correlation with higher production expectations. In 2021/22, lemon production is expected to increase 27 percent to 1.4 million MT with good quality fruit due to favorable weather conditions in late spring in 2021. The main problems reported by lemon producers in Turkey are diseases and pests, input costs such as fertilizers and chemicals, labor costs for tree trimming, crop quality, and marketing issues. 

    Figure 1. Turkish Citrus Exports by Products, Marketing Years (MY) 2018-2020

    Harmonized System (HS) Codes:

    Oranges 080510
    Tangerines/Mandarins 080520, 080521, 080522, 080529 Lemons 080550
    Grapefruits 080540
    Orange Juice 200911, 200912, 200919

    Abbreviations used in this report:

    FAS USDA Foreign Agricultural Service TDM Trade Data Monitoring
    MT Metric ton (1,000 kg)
    MMT Million Metric Tons

    GoT The Government of Turkey
    MinAF Turkish Ministry of Agriculture and Forestry MY Marketing year
    PS&D Production, Supply and Distribution
    TL Turkish Lira
    TurkSTAT Turkish Statistical Institute
    USD U.S. Dollar

    Commodities:

    Oranges, Fresh

    Production:

    In MY 2021/22, the orange yield is forecast to increase 40 percent to 1.82 MMT due to favorable rainy weather conditions in March and April 2021. However, in recent months, producers have become concerned about drought conditions affecting the fruit. According to producers, water which is provided by the Irrigation Unions in the region, has already been restricted for orchards due to overall decreasing water levels in local dams because limited rainfall. This issue affects the quality of the fruit but doesn’t greatly affect the yield, according to producers. On the other hand, the yield in the Aegean region is expected to decrease 15 percent due to the freezing weather conditions during the Spring 2021 months.

    Figure 2. Turkey Orange Production and Orchards Comparison, MY 2018/19 – 2020/21

    In MY 2020/21, Turkey produced 1.3 million MT of oranges, which is 23 percent lower than MY 2019/20 (1.7 million MT), due to excessive hot weather conditions in May 2020 during the blooming period of trees. Losses and tonnage problems were seen in MY 2020/21, especially for the Washington variety, which produced 25 percent less fruit than the previous season. Orange production totaled 31 percent of Turkey’s total citrus production in MY 2020/21.

    Turkey produces mostly the Washington variety of oranges, with that variety accounting for 70 percent of total orange production. Eighty-five percent of oranges are produced in the Mediterranean region while 15 percent are produced in Aegean region. 

    The Mediterranean fruit fly is still a major concern. Producers are planning to harvest and sell their products much earlier than normal in order to prevent exposure to the harmful flies. In addition, the input costs for items such as fertilizer, fuel, and pesticides are still considered too high while farm gate prices are too low to compensate for the high production costs. Producers are concerned about MY 2021/22 production since it is expected that input prices will continue to increase, especially fuel and fertilizers.

    Figure 3. Orange Producers Gate Prices, Comparison TL and $ Basis

    As shown in Figure 2, the number of orchards has been decreasing for the last 3 years as producers convert orchard land or determine profits are not great enough to invest fertilizer and pesticides. However, the area is expected to increase for MY 2021/22. The decrease in MY 2020/21 was seen mostly in orchards of the Washington and yapha varieties while orchards for other varieties have been increasing in correlation with export demands. Also, some of producers has converted their orchards from oranges and tangerines to Pitaya fruit due to high demands from touristic places. In MY 2020/21, orange orchards consist of 29 percent of total citrus orchards areas. According to producers, uncertainity concerning gate prices and lack of production technologies are the main negative factors for marketing of oranges.

    Consumption:

    In MY 2021/22, orange consumption is expected to increase to 1,488 MMT in correlation with high production expectations. In MY 2020/21, orange consumption was realized at 1,018 MT in correlation with lower production. The market price of oranges at supermarkets has been increasing, like many commodities, due to multiple stakeholders in the market chain and increasing food inflation. On the other hand, retail prices decreased in January and February 2021 since the GoT applied export restrictions to address EU regulations regarding limited pesticides residues. Many Turkish citrus exports are routinely rejected from the EU and Russia due to maximum residue levels above the importing allowances. Less exports helped the domestic orange market prices to decrease.

    In 2019/20, orange consumption per capita was 12.3 kg. In Turkey, oranges account for 49 percent of total citrus consumption. According to the sector, orange consumption has shrunk 17 percent over the last five years.

    Figure 4. Orange Retail Market Price Changes, Monthly, 2019-2020-2021

    Trade:

    Orange exports in MY 2021/22 are expected to increase 20 percent to 265,000 MT when compared with the previous season in correlation with high yield expectations and assuming normal levels of precipitation over the winter months.

    In 2020/21, Turkey exported 220,630 MT of oranges, which was 24 percent lower than the MY 2019/20 total of 291,846 MT, due to very low yields and the export restrictions laid down by MinAF at the beginning of 2021. For more information about the restrictions, please click here. In MY 2019/20, although orange exports in volume were lower than the previous season due to logistic problems because of the COVID-19 pandemic, the export value was higher than the previous season.

    Figure 5. Turkey Orange Exports (MT) and Export Value ($) Comparison, MY 2018/19-MY 2020/21

    Figure 6. Turkish Orange Exports, Comparison Table for MY 2018/19 – 2020/21

    Russia, Iraq, and Ukraine are the main Turkish orange export markets. In January 2021, the exports to Ukraine reduced 79 percent, the exports to Romania reduced 59 percent and exports to Iraq reduced 52 percent due to the MinAF export restrictions.

    According to exporters, varieties and fruit quality need to be improved and new markets such as China, Far East Countries, South Korea, and the U.S. need to be opened in order to make profits from exports. Storage conditions also need to be improved in order to avoid price fluctuations in the domestic market and foreign markets as well. Better storage facilities will enable Turkish producers to sell their products at a steady supply throughout the year, including at higher prices during lower harvest months. Recently, the European Union has increased import control inspection frequency for Turkey from 10 percent to 20 percent to address pests and maximum residue levels (MRLs) of pesticides. Turkey’s orange export value has decreased 44 percent compared to five years ago.

    Figure 7. Turkish Orange Exports, Country Comparison for MY 2018/19- MY 2020/2021

    Imports: Orange imports In MY 2021/22 are expected to stagnate at 43,000 MT, as realized in MY 2020/21. Turkey imported 43,628 MT of oranges in MY 2020/21, and 98 percent of the orange imports came from the Turkish Republic of Northern Cyprus (TRNC). Turkey`s orange imports depend on the low production, climate change and dispersion of production with small size orchards. Read the full report from the USDA Foreign Agricultural Service HERE.