Category: Economics

  • Turkish Orange Crop Forecast Up 40%

    Turkish Orange Crop Forecast Up 40%

    In Market Year (MY) 2021/22, the orange yield is forecast to increase 40 percent to 1.82 million metric tons (MMT) due to favorable rainy weather conditions in March and April 2021. The input costs for items such as fertilizer, fuel, and pesticides are still considered too high while farm gate prices are too low to compensate for the high production costs. Orange exports in MY 2021/22 are expected to increase 20 percent to 265,000 MT when compared with the previous season in correlation with high yield expectations. Tangerine exports in MY 2021/22 are expected to increase 11 percent to 1 MMT in correlation with higher production expectations. In 2021/22, lemon production is expected to increase 27 percent to 1.4 million MT with good quality fruit due to favorable weather conditions in late spring in 2021. The main problems reported by lemon producers in Turkey are diseases and pests, input costs such as fertilizers and chemicals, labor costs for tree trimming, crop quality, and marketing issues. 

    Figure 1. Turkish Citrus Exports by Products, Marketing Years (MY) 2018-2020

    Harmonized System (HS) Codes:

    Oranges 080510
    Tangerines/Mandarins 080520, 080521, 080522, 080529 Lemons 080550
    Grapefruits 080540
    Orange Juice 200911, 200912, 200919

    Abbreviations used in this report:

    FAS USDA Foreign Agricultural Service TDM Trade Data Monitoring
    MT Metric ton (1,000 kg)
    MMT Million Metric Tons

    GoT The Government of Turkey
    MinAF Turkish Ministry of Agriculture and Forestry MY Marketing year
    PS&D Production, Supply and Distribution
    TL Turkish Lira
    TurkSTAT Turkish Statistical Institute
    USD U.S. Dollar

    Commodities:

    Oranges, Fresh

    Production:

    In MY 2021/22, the orange yield is forecast to increase 40 percent to 1.82 MMT due to favorable rainy weather conditions in March and April 2021. However, in recent months, producers have become concerned about drought conditions affecting the fruit. According to producers, water which is provided by the Irrigation Unions in the region, has already been restricted for orchards due to overall decreasing water levels in local dams because limited rainfall. This issue affects the quality of the fruit but doesn’t greatly affect the yield, according to producers. On the other hand, the yield in the Aegean region is expected to decrease 15 percent due to the freezing weather conditions during the Spring 2021 months.

    Figure 2. Turkey Orange Production and Orchards Comparison, MY 2018/19 – 2020/21

    In MY 2020/21, Turkey produced 1.3 million MT of oranges, which is 23 percent lower than MY 2019/20 (1.7 million MT), due to excessive hot weather conditions in May 2020 during the blooming period of trees. Losses and tonnage problems were seen in MY 2020/21, especially for the Washington variety, which produced 25 percent less fruit than the previous season. Orange production totaled 31 percent of Turkey’s total citrus production in MY 2020/21.

    Turkey produces mostly the Washington variety of oranges, with that variety accounting for 70 percent of total orange production. Eighty-five percent of oranges are produced in the Mediterranean region while 15 percent are produced in Aegean region. 

    The Mediterranean fruit fly is still a major concern. Producers are planning to harvest and sell their products much earlier than normal in order to prevent exposure to the harmful flies. In addition, the input costs for items such as fertilizer, fuel, and pesticides are still considered too high while farm gate prices are too low to compensate for the high production costs. Producers are concerned about MY 2021/22 production since it is expected that input prices will continue to increase, especially fuel and fertilizers.

    Figure 3. Orange Producers Gate Prices, Comparison TL and $ Basis

    As shown in Figure 2, the number of orchards has been decreasing for the last 3 years as producers convert orchard land or determine profits are not great enough to invest fertilizer and pesticides. However, the area is expected to increase for MY 2021/22. The decrease in MY 2020/21 was seen mostly in orchards of the Washington and yapha varieties while orchards for other varieties have been increasing in correlation with export demands. Also, some of producers has converted their orchards from oranges and tangerines to Pitaya fruit due to high demands from touristic places. In MY 2020/21, orange orchards consist of 29 percent of total citrus orchards areas. According to producers, uncertainity concerning gate prices and lack of production technologies are the main negative factors for marketing of oranges.

    Consumption:

    In MY 2021/22, orange consumption is expected to increase to 1,488 MMT in correlation with high production expectations. In MY 2020/21, orange consumption was realized at 1,018 MT in correlation with lower production. The market price of oranges at supermarkets has been increasing, like many commodities, due to multiple stakeholders in the market chain and increasing food inflation. On the other hand, retail prices decreased in January and February 2021 since the GoT applied export restrictions to address EU regulations regarding limited pesticides residues. Many Turkish citrus exports are routinely rejected from the EU and Russia due to maximum residue levels above the importing allowances. Less exports helped the domestic orange market prices to decrease.

    In 2019/20, orange consumption per capita was 12.3 kg. In Turkey, oranges account for 49 percent of total citrus consumption. According to the sector, orange consumption has shrunk 17 percent over the last five years.

    Figure 4. Orange Retail Market Price Changes, Monthly, 2019-2020-2021

    Trade:

    Orange exports in MY 2021/22 are expected to increase 20 percent to 265,000 MT when compared with the previous season in correlation with high yield expectations and assuming normal levels of precipitation over the winter months.

    In 2020/21, Turkey exported 220,630 MT of oranges, which was 24 percent lower than the MY 2019/20 total of 291,846 MT, due to very low yields and the export restrictions laid down by MinAF at the beginning of 2021. For more information about the restrictions, please click here. In MY 2019/20, although orange exports in volume were lower than the previous season due to logistic problems because of the COVID-19 pandemic, the export value was higher than the previous season.

    Figure 5. Turkey Orange Exports (MT) and Export Value ($) Comparison, MY 2018/19-MY 2020/21
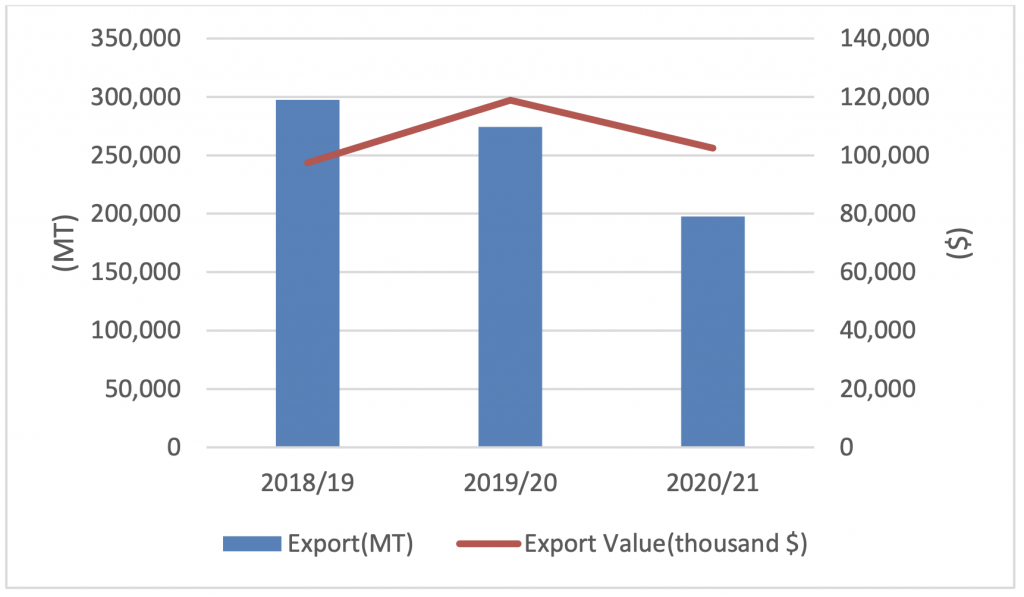
    Figure 6. Turkish Orange Exports, Comparison Table for MY 2018/19 – 2020/21

    Russia, Iraq, and Ukraine are the main Turkish orange export markets. In January 2021, the exports to Ukraine reduced 79 percent, the exports to Romania reduced 59 percent and exports to Iraq reduced 52 percent due to the MinAF export restrictions.

    According to exporters, varieties and fruit quality need to be improved and new markets such as China, Far East Countries, South Korea, and the U.S. need to be opened in order to make profits from exports. Storage conditions also need to be improved in order to avoid price fluctuations in the domestic market and foreign markets as well. Better storage facilities will enable Turkish producers to sell their products at a steady supply throughout the year, including at higher prices during lower harvest months. Recently, the European Union has increased import control inspection frequency for Turkey from 10 percent to 20 percent to address pests and maximum residue levels (MRLs) of pesticides. Turkey’s orange export value has decreased 44 percent compared to five years ago.

    Figure 7. Turkish Orange Exports, Country Comparison for MY 2018/19- MY 2020/2021

    Imports: Orange imports In MY 2021/22 are expected to stagnate at 43,000 MT, as realized in MY 2020/21. Turkey imported 43,628 MT of oranges in MY 2020/21, and 98 percent of the orange imports came from the Turkish Republic of Northern Cyprus (TRNC). Turkey`s orange imports depend on the low production, climate change and dispersion of production with small size orchards. Read the full report from the USDA Foreign Agricultural Service HERE.
  • Costa Rican Orange Production and Exports Expected to Rebound in 2022 Despite Battle with HLB

    Costa Rican Orange Production and Exports Expected to Rebound in 2022 Despite Battle with HLB

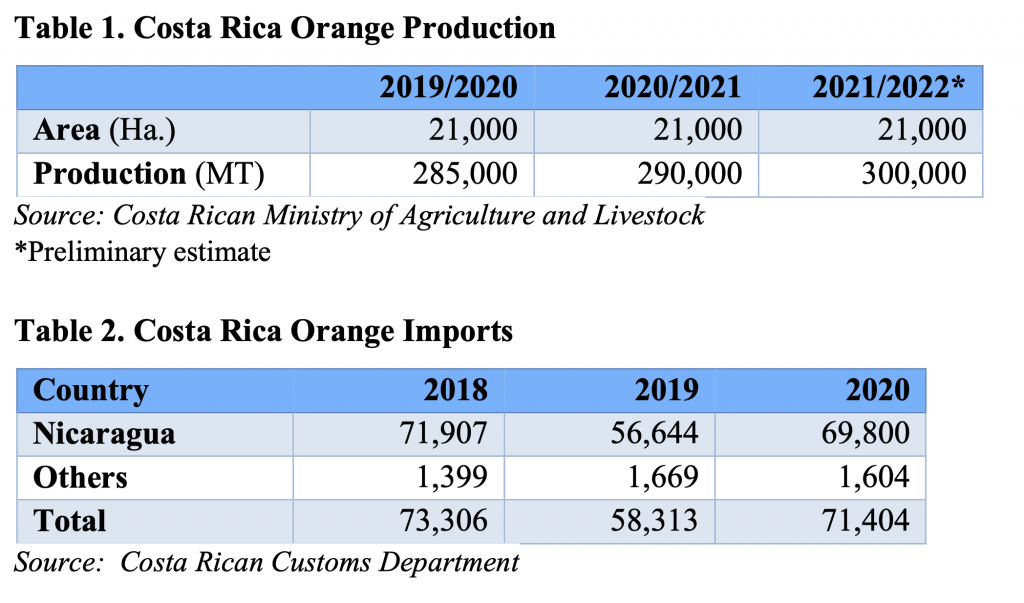
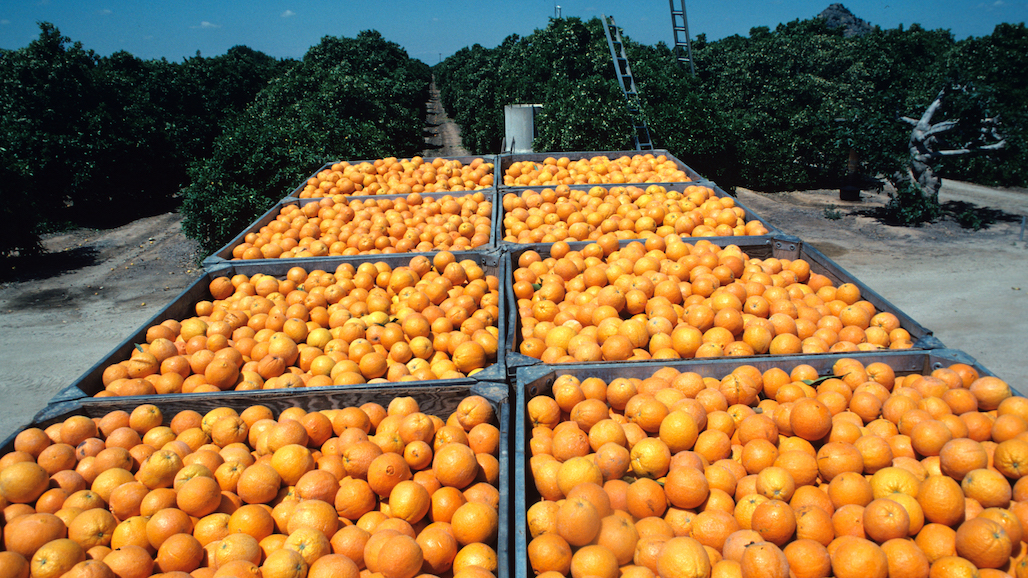
    After overcoming COVID-related labor and supply chain disruptions, Costa Rica’s orange production is expected to rebound to 300,000 metric tons in 2022, pushing total orange juice exports slightly higher to 33,000 metric tons. Despite some success in mitigating the worst impacts of citrus greening, the disease is expected to limit near-term prospects for Costa Rican industry growth.

    Commercial orange production is concentrated in the northern part of Alajuela province (around Los Chiles, Guatuso, and Upala) and in the northern part of Guanacaste province (near the border with Nicaragua in an area known as Santa Cecilia).

    Figure 1. Map of Costa Rican Growing Area (highlighted in red)

    Two companies, TicoFrut and Del Oro, control most of the production and practically all processing of oranges in the country. TicoFrut is the largest company in the sector. TicoFrut’s plantations are located primarily in the province of Alajuela (near the border with Nicaragua) and in Nicaragua. Oranges from the Nicaraguan plantations are trucked across the border in Los Chiles for processing at TicoFrut’s plant located in Muelle, San Carlos, about 50 miles to the south of the border. Del Oro’s plantations are in the province of Guanacaste, near the border with Nicaragua. Oranges are also grown in other regions of the country including Acosta (near the Central Valley) and Nandayure in Guanacaste. However, oranges from those areas are mostly sold as fresh fruit in the local market.

    There are also some medium and small size independent producers near the areas where the two processing plants are located. While the larger operations have been stable and plan their activities with a longer-term view, the smaller independent producers tend to supply the processing market (rather than selling into the fresh fruit market) in response to short-term price fluctuations. Smaller producers have also been exiting orange production altogether over time as orange yields and orange prices have made other activities more attractive.

    Harvest is mainly from January to May, with peak production in March and April. The vast majority of commercial oranges are processed for juice concentrate for the export market. A relatively small volume of fresh fruit is sold for local consumption, and processing plants also sell small volumes of juice to local food processors for branded products and for further processing.

    TicoFrut has orange plantations in Nicaragua, near the border. Growing conditions are favorable in that area, and land prices and labor costs are generally lower. Costa Rican processors have partnered with Nicaraguan businesses to plant orange groves in Nicaragua for processing in Costa Rica. According to data from the Government of Costa Rica, the country imported 69,800 metric tons (MT) of fresh oranges from Nicaragua in 2020, compared to 56,644 MT during 2019. Imports from Nicaragua during 2021 reached 66,444 MT through October.

    Within orange area planted, farmers are gradually increasing the number of trees per hectare by using the “Flying Dragon” pattern, which supports higher tree density, easier farm management, and lower costs per hectare. This innovation has allowed farmers to significantly increase tree density, moving up from 300 – 450 trees/ha under traditional planting patterns to 800 to 900 trees/ha with the Flying Dragon. FAS/San José anticipates major growers to direct investments toward replanting existing area with new trees and new patterns, rather than increasing area planted, in the near- to medium-term.  Local industry estimates area planted at around 21,000 hectares (ha) and 7.4 million orange trees, including the area planted on the Nicaraguan side of the border. With reports of reductions in area planted to oranges as citrus greening disease changes yields and profitability calculations FAS/San José expects area planted to remain flat or decline slightly in 2022 as the effects of citrus greening persist and as major growers concentrate on improvements to current production areas through replanting and irrigation investments.

    Citrus greening disease was first identified in Costa Rica in 2011 and remains a major concern for producers. Citrus greening is reportedly endemic throughout most of the country’s growing areas, increasing costs, decreasing yields, adding uncertainty to future production plans, and limiting growth of production area and volumes. The largest farms have had some success mitigating the effects of the disease by establishing strict controls, including constant farm surveillance, inspection of all farms, and eradication of 100 percent of affected plants. Better capitalized producers use agrochemicals and biological controls (a wasp, called tamarixia radiata, that feeds on the vector of the disease) as part of their preventive measures. The disease has reportedly caused production area to be reduced or abandoned, but FAS/San José has not been able to confirm the extent. Smaller producers, less capable of and less likely to invest in agrochemicals and biological controls, have reportedly suffered heavier losses.

    FAS/San José forecasts total production to increase by 3 percent to 300,000 MT in MY 2021/2022. The largest farms have stabilized production levels through consistent citrus greening management over the last few years, resulting in smaller overall production fluctuations. In 2020/2021, the sector benefited from a more predictable, formalized government migration process for temporary laborers during the pandemic. Securing imported labor supplies was crucial not only for the 2021 harvest, but also for agricultural management practices earlier in the growth cycle (e.g., during flowering) that require imported labor. According to industry sources, fuel and fertilizer costs have increased approximately 30 percent in 2021, adding to the not insignificant additional costs of managing citrus greening – agrochemicals, integrated pest management, and eradication of affected plants.

    Costa Rica exports most of its orange production as frozen concentrated orange juice (FCOJ); single strength fresh orange juice exports represent less than 25 percent of total export volume. According to information from the Costa Rican Trade Promotion Board (PROCOMER), calendar year 2020 juice exports to all destinations amounted to 21,800 MT (valued at $34.6 million), down considerably from 32,897 MT (valued at $50 million) in 2019. Trade data through October 2021 show total exports rebounding to 30,819 MT and $42.9 million, respectively.

    FAS/San José expects 2021/22 total exports to increase slightly to 33,000 MT. The United States continues to be Costa Rica’s leading destination for orange juice exports in 2021. Total exports to the United States through October 2021 were 16,582 MT (valued at $31.1 million), already surpassing the 13,177 MT (valued at $26.9 million) shipped to the United States in 2020. Costa Rican orange juice enters the United States duty free under the Central American-Dominican Republic Free Trade Agreement. — By Victor Gonzalez, USDA Foreign Agricultural Service

  • CA Avocado Commission State of the Industry Report Available

    CA Avocado Commission State of the Industry Report Available

    To provide the California Avocado Commission (CAC) and the growers it serves with a better perspective on the health of the California avocado industry, CAC retained the Tootelian Company to conduct a member survey. Summary findings from the report are now available on the California avocado grower website.

    The survey was sent to all CAC members in August 2021. The 77-page report includes detailed findings concerning:

    • Farm acreage
    • Pounds harvested and crop values by district and acreage
    • Overall farm income, expenses and net margin
    • Farm income, expenses and net margin by district and acreage
    • Water sources
    • Overall irrigation costs
    • Irrigation costs by water source, district and acreage
    • Perceived threats to future profitability

    Highlights from the survey are as follows:

    • Across all districts, bearing acres comprised about 80% of total acres.
    • From 2018 – 2020, the average number of pounds harvested per bearing acre declined at a rate of -2.4% per year.
    • During this same time frame, the average crop value per bearing acre rose at a rate of 0.8% per year. When examined by the acreage of the operation, the annual growth rates in crop values per bearing acre (2018-2020) were 6.7% for farms with 10 acres or less, 2.3% for farms with 11 – 50 acres and -1.4% for those with 51 acres or more.
    • The three-year average for total expenses as a percent of gross income was 93.7% with an average net margin of 6.3%.
    • Average gross income was 2.7% per year with expenses growing at a 4.4% rate annually.
    • Respondents indicated they did not change their water sources much from 2018 – 2020 with District 1 and District 2 relying primarily on water agencies, District 4 utilizing mutual water companies and Districts 3 and 5 relying mainly on wells/surface water on the property.
    • Overall irrigation costs per dollar of crop value dropped from 18.9% in 2018 to 15.9% in 2020, with irrigation costs as a percent of total expenses dropping from 20.2% in 2018 to 15.3% in 2020.
    • The highest average irrigation costs per acre in 2020 were associated with mutual water companies ($1,389/acre) and water agencies ($1,157/acre) and lowest when growers combined well/surface water with water agencies ($698/acre) and wells/surface water with mutual water companies ($555/acre).
    • Respondents indicated the most serious threats to future profitability are water costs, costs of complying with government regulations and labor costs.
    • Other factors identified as threats to profitability included availability of water, imported avocados and environmental regulations.

    Findings from the survey will be used to help the Commission explore potential opportunities to address growers’ most pressing challenges.

  • New Economic Analysis Underscores Impact of Pandemic on Farmers, Agriculture

    We have all felt the seismic shift from the pandemic and its impact on our lives and livelihoods. Throughout the pandemic farmers and farm workers have worked diligently and continually to deliver healthy and safe fruits and vegetables to consumers. But the pandemic further exposed the tight margins of farming and the intense cost pressures being faced in agriculture today.
    The Grower Shipper Association of Central California (GSA) commissioned a new analysis by economists to examine the cost impacts of the pandemic as well as other factors, such as supply chain issues, which are putting pressure on agriculture’s ability to sustain food production in the region.

    The mission of GSA is advancing families, food and farming in Central California. These types of analyses are an important way to assess vulnerabilities associated with increasing costs as well as identify potential areas where better solutions may be necessary to advance our mission. It also allows GSA to assess their role in supporting members and ag employees by relieving or alleviating economic burden through solution-driven work.

    This analysis provides a short and long-run outlook and focuses on current, continuing and impending cost pressures within a landscape of the economic fundamentals of supply and demand. While there are numerous crops produced in our region, the economists determined their analysis would focus on one crop specifically in order to appropriately identify industry cost pressures. Therefore the analysis examines the per carton costs of growing and shipping iceberg lettuce.

    The economists determined the total cost to produce a carton of iceberg lettuce is over $17 per carton. The average baseline production budget for Salinas Valley iceberg lettuce shows typical costs to grow, harvest, and pack is around $15 per carton. According to the analysis, the estimated increase in direct lettuce production costs identified is $2.12 per carton. This includes a $0.68 increase to growing costs and a $1.44 increase for harvest, packing, and cooling costs including a $0.67 increase due to operational changes related to COVID-19.

    At an average price of $15 to $17 per carton, grower-shippers are not able to cover production costs. The economists state that an increase of $2.12 per carton with 24 heads of lettuce may seem immaterial from the consumer perspective – this would work out to $0.09 per head. However, they point out that this change is quite significant for farmers and shippers.

    These findings are sobering and reinforce GSA’s commitment to support our mission through results oriented efforts. As an example, GSA’s work to protect employees from the spread of COVID-19 included the creation of a model quarantined housing program as well as a mass vaccination program responsible for having immunized a majority of the farm workers in the region. While the primary objective of this effort was to keep farm workers and their families healthy, the development and operation of this vaccination program, in partnership with Clinica De Salud Del Valle De Salinas, also likely lowered the economic burden of COVID-19 on ag employers since it allowed the region to continue consistently harvesting and shipping produce.

    As we address the economists’ findings, GSA and the farmers and farming companies we represent understand their responsibility to grow safe food, protect farm workers, nurture and sustain our farms and the environment around them and be good neighbors and stewards of our communities where we live and work. We acknowledge that thoughtful, outcome-oriented regulations can provide necessary baseline uniformity that govern practices in the workplace including environmental and food and worker safety protections that benefit our community and consumers. However, when new regulations or legislation that impacts agriculture are being considered, farmers should have a seat at the table and cost impacts should be discussed and evaluated, especially in light of the profit margins identified in this analysis.

    While a safe workplace, a healthy environment and safe food are of paramount importance, a strong economy creates important opportunities and support that benefits our communities and should remain a priority as well. In fact, 77% of Bay Area and Central Coast residents agree that agriculture was most or very important to the quality of life and the economy of California in a survey conducted by GSA. This reflects the value of agriculture, including job-creation, support of community initiatives and charities, preservation of green and open spaces and local food production.

    Learn more about the findings from this economic analysis on our new page in the Our Work section of the GSA website. On this page you will find a white paper outlining the findings of the analysis as well as a link to the full report.

  • 2021-22 CA Navel and Mandarin Forecast Down from Initial Estimates

    2021-22 CA Navel and Mandarin Forecast Down from Initial Estimates

    The California Citrus Mutual Marketing Committee (Committee) estimates that the total Navel orange crop for the 2021-22 season will be down 20% from the previous season’s final utilized, or sold, production. The Committee also estimates that the Mandarin crop will be down as much as 45% from the 2020-2021 season.

    According to the California Department of Food and Agriculture’s 2021-22 California Navel Orange Objective Measurement Report, released on September 10, 2021, the initial forecast for the navel orange crop was 70.0 million cartons, down 14% from the previous year’s total utilized production. Additionally, an estimated 4% of last season’s crop was not utilized, meaning it was not picked or sold.

    Now several weeks into 2021-22 season, the Committee anticipates, based on current picking estimates, will be 20% below the prior season’s total utilized production and approximately 24% below the total crop size.

    The drop in production is attributed to the previous season’s heavy crop and extended season. Due to the larger sized crop and other market conditions, fruit remained on the tree far longer than is typical, which negatively affected the current year’s crop size.

    The Committee also estimates that the 2021-22 mandarin crop will be down 45% from the previous season’s exceptionally large crop.

    The current navel and mandarin crops are forecast to go through May and June, respectively.  Consumers can expect favorable size structure and excellent eating quality due to the fruit’s high sugar content.

    “The 2021-22 season is shaping up to be far different than the previous season. Last season, we had a very heavy crop and there were a lot of growers whose fruit was never harvested. Shippers extended the season well into August in an effort to market and sell as much of the crop as possible, but ultimately about 4% was dropped to the ground,” says CCM President/CEO Casey Creamer. “We expect this year’s lighter crop to move more quickly through the market with its high sugar content and excellent eating quality.”

  • What US Food Exporters Need to Know about China’s New Facility Registration Requirements

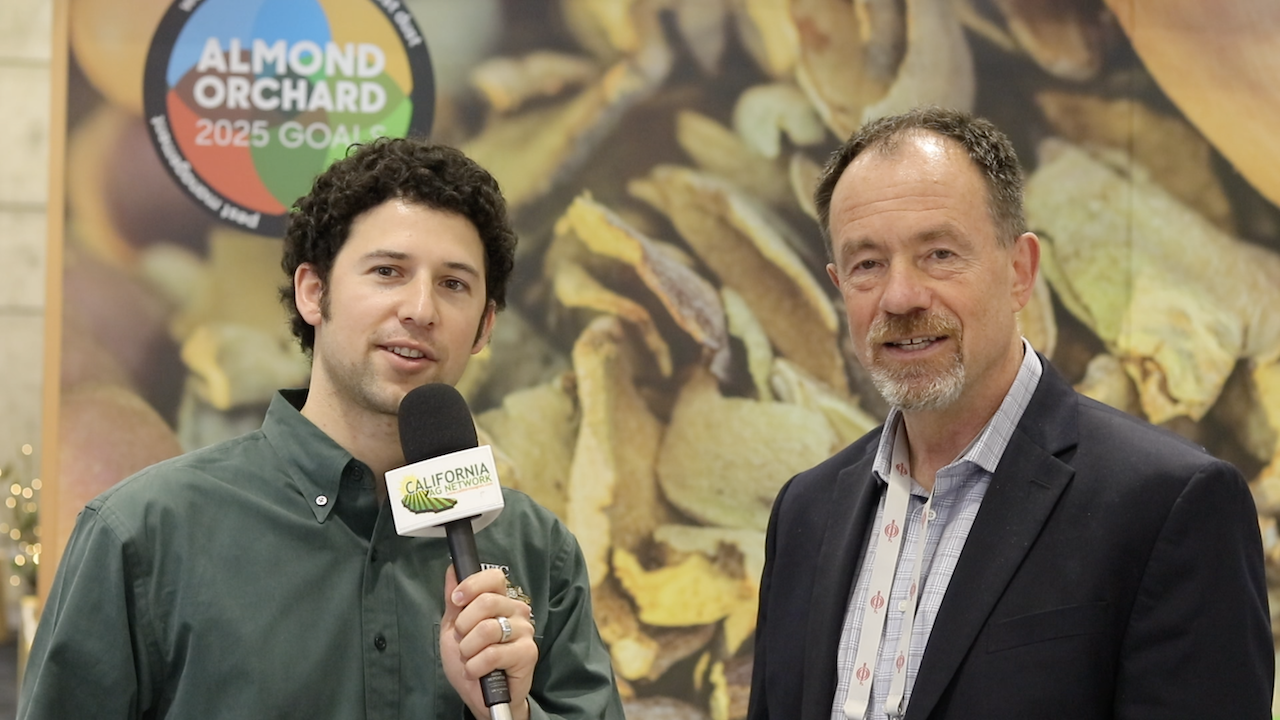
    Port congestion and unresolved international trade disputes are tough enough, without China’s new facility registration requirements going into effect at the start of 2022 for food export destined for China.  Watch this brief interview with Keith Schneller, Trade Policy Specialist for the Almond Board of California,  as he explains the issue and how FDA is addressing it.
    Please thank this video’s sponsor Suterra for their industry support.
  • What US Food Exporters Need to Know about China’s New Facility Registration Requirements

    What US Food Exporters Need to Know about China’s New Facility Registration Requirements

    Port congestion and unresolved international trade disputes are tough enough, without China’s new facility registration requirements going into effect at the start of 2022 for food export destined for China.  Watch this brief interview with Keith Schneller, Trade Policy Specialist for the Almond Board of California,  as he explains the issue and how FDA is addressing it.
    Please thank this video’s sponsor Suterra for their industry support.
  • Jacob Villagomez Hired as CA Citrus Mutual Director of State Governmental Affairs

    Jacob Villagomez Hired as CA Citrus Mutual Director of State Governmental Affairs

    California Citrus Mutual (CCM) is proud to announce we have hired Jacob Villagomez as the new Director of State Governmental Affairs. He comes to us from the State Senate, where he previously served as the District Director for Senator Melissa Hurtado.

    In his new role, Jacob will advocate on behalf of California’s citrus growers in the State legislature and within administrative and regulatory agencies.

    “I am extremely excited to add another talented member to the CCM team,” stated President/CEO Casey Creamer. “Jacob’s time as a legislative staffer will add valuable experience and perspective to the organization as we deal with significant concerns related to water, pest management, labor, and the overall cost of doing business in California. As a son of citrus farmers in the Sanger area, he has a vested interest in our success and a strong passion to bring positive change for the industry.”

    Jacob attended California State University, Fresno where he graduated Magna Cum Laude with a Bachelor of Arts in Political Science. He is also an alumnus of the Kenneth L. Maddy Institute’s Legislative Scholars program and a graduate of the Fresno County Farm Bureau’s Future Advocates Concerned About Tomorrow (FAACT) program.

    About California Citrus Mutual (CCM)

    CCM is a voluntary, non-profit trade association representing CA citrus growers on the economic, regulatory, and political issues that impact them most.

  • Citrus Growers Welcome Rain and Anticipated Cold Weather

    Citrus Growers Welcome Rain and Anticipated Cold Weather

    As rain and expected cold weather sweep through the citrus belt of California, growers are looking forward to the positive effects that this weather is bringing.

    Water and the current drought top growers’ concerns and the needed rain will have positive effects on the water supply and improve fruit size and quality.

    Following today’s rain, temperatures are expected to drop to freezing and below. As currently forecasted, the sub-freezing temperatures will be a benefit to the crop. The colder temperatures will help send trees into dormancy as well as helping to improve coloring and overall quality.

    California Citrus Mutual employs weather stations up and down the citrus belt and provides citrus-specific forecasts to help members anticipate weather issues. Growers will be monitoring conditions closely over the weekend and will be prepared to run water or turn on wind machines to alleviate any negative effects of the lower temperature.

    About California Citrus Mutual

    CCM is a voluntary, non-profit trade association representing CA citrus growers on the economic, regulatory, and political issues that impact them most.

  • HLB Quarantine Expansion Connects Boundaries in Jurupa Valley and Riverside Areas

    HLB Quarantine Expansion Connects Boundaries in Jurupa Valley and Riverside Areas

    Effective Dec. 6, 2021, the California Department of Food and Agriculture (CDFA) has expanded the Huanglongbing (HLB) quarantine boundaries in Riverside and San Bernardino counties in the Jurupa Valley and Riverside areas to create one quarantine area, connecting parts of Orange, Los Angeles, Riverside and San Bernardino counties. A map of the boundary expansion can be found below and at https://www.cdfa.ca.gov/plant/hlb/regulation.html#maps.

    Additionally, effective Dec. 6, 2021, CDFA is expanding the Asian citrus psyllid bulk citrus quarantine zone 6 in Riverside and San Bernardino counties to reflect the HLB boundary expansion. A map of the proposed new boundaries can be found at https://www.cdfa.ca.gov/citrus/pests_diseases/acp/regulation.html.

    For any questions regarding the regulations or quarantine area, please email Karina Chu at Karina.Chu@cdfa.ca.gov or call 916-274-6300.