Category: Industry News

  • Preventing & Managing Wind Damage In CA Avocado Groves

    Preventing & Managing Wind Damage In CA Avocado Groves

    California Avocado Commission — When it comes to potential wind damage, California avocado growers typically face two different scenarios: chronic wind exposure or severe wind events.

    Avocado trees housed in windy portions of a grove are often stunted and underperform production wise.  They also may be water stressed, which will impact the uptake of minerals, and their roots may be stressed due to consistent rocking caused by the wind. The only remedy, in these cases, is to create a wind shelter that minimizes wind exposure.

    In windy groves, fruit often will exhibit markings that can be mistaken for diseases or pest damage. For example, black marks caused by wind may be mistaken for anthracnose post harvest rot or russet scars may lead growers to suspect their trees have persea thrips damage. While some superficial wind damage may not affect the quality of the fruit – particularly if that damage occurs when the fruit is young – some wind damage can lead to large scars or “alligator skin” that are more impactful to fruit quality.

    Severe wind events often blow avocado trees over. In these instances, unless the tree is very young, consider removing the tree. Attempting to move the tree back into an upright position can further damage the roots. If the fallen trees looks like it will recover, it can remain where it is. New shoots may emerge from the trunk and form the structure for a new tree. If this occurs, large, old branches can be removed later as the new portion of the tree takes shape. If you do remove the tree, avoid planting a new tree close to where the old tree existed unless you remove the stump and sterilize the soil. The roots from the old tree could become infected by Phytophthora root rot and thus infect a new tree.

    Strong wind events also can break limbs or blow fruit off the trees. After a storm, windfall should be properly disposed of and broken branches removed.  It is important to monitor trees after severe storms, paying close attention to signs of wilting that may indicate stressed roots or a broken branch that was missed during earlier assessments.

    For more information about preventing and managing wind damage, visit the California Avocado Commission’s wind protection online library.
  • South Africa Ramps up Grapefruit & Mandarin Exports to US

    South Africa Ramps up Grapefruit & Mandarin Exports to US

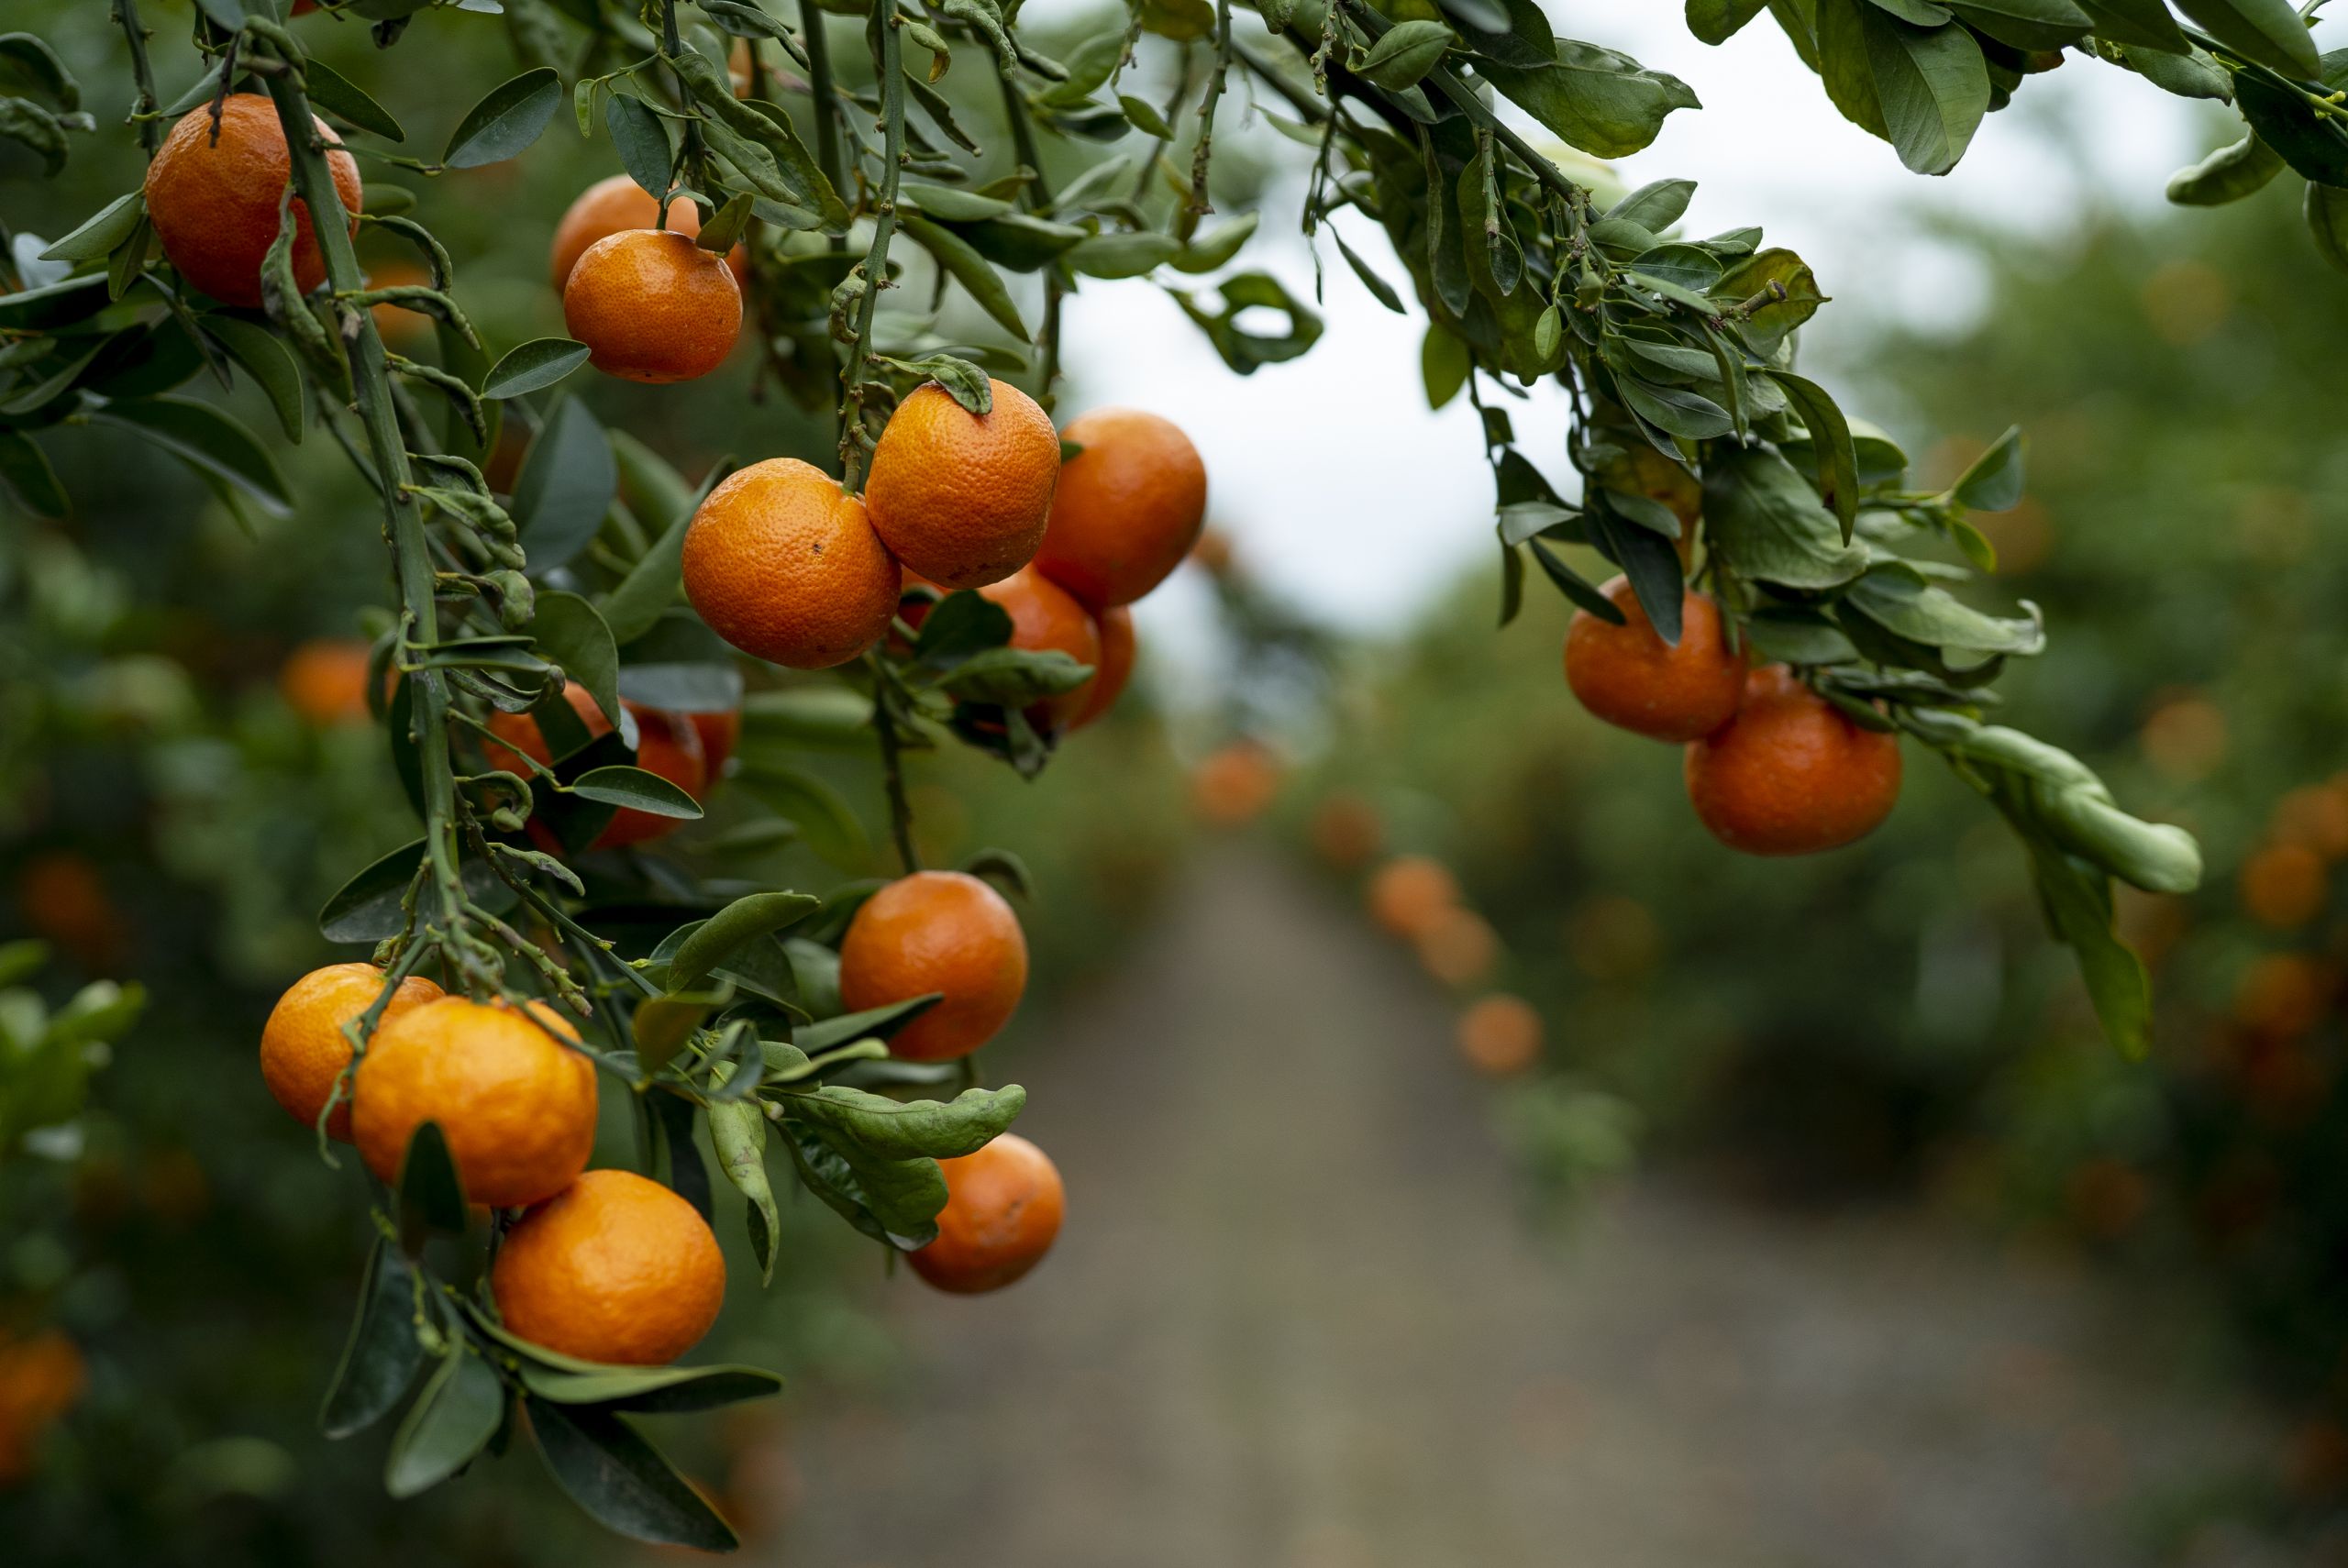
    The production of South African citrus, mainly soft citrus, new orange varieties, lemons and limes is forecast to continue its strong growth in the 2020/21 Marketing Year (MY), based on the increase in area planted, improved yields, high level of new-plantings coming into full production, and the minimal impact of COVID-19 on labor and input supply. Duty free exports of citrus to the United States under the African Growth Opportunity Act (AGOA) are expected to continue their strong annual growth, as the United States is still considered a premium market. 

    Citrus in South Africa is grown across the country mainly in the Limpopo, Eastern Cape, Western Cape, Mpumalanga, Kwa Zulu Natal, Northern Cape and North West provinces. A total of 86,808 hectares was planted to citrus in South Africa in 2019, a 6 percent increase from 81,603 hectares in 2018. This growth trend is forecast to continue in 2020 to 95,200 hectares, based on the significant investments and aggressive new plantings of soft citrus, lemons, and new varieties of oranges.

    The Limpopo province is the country’s largest citrus production area, accounting for 42 percent of the total area planted, followed by the Eastern Cape (27 percent), Western Cape (19 percent), Mpumalanga (8 percent), Kwa Zulu Natal (2 percent), Northern Cape (2 percent), North West (less than 1 percent), and Free State (less than 1 percent). The Western Cape and Eastern Cape have a cooler climate, which is suited for the production of the navel oranges, lemons, limes, and tangerines/mandarins (soft citrus). The Mpumalanga, Limpopo and KwaZulu-Natal provinces have a warmer climate, which is better suited to the production of grapefruit and Valencia oranges.

    While oranges are the biggest citrus type produced in South Africa and account for 50 percent of the total citrus area planted, there has been notable growth in the area planted to soft citrus and lemons/limes. This growth is driven by the attractive investment returns, profit margins from soft citrus and lemon production, and a spike in global demand. In 2016, the tango citrus variety, which was developed by the University of California Riverside, was granted the plant breeders right in South Africa and is expected to offer competition to the Nardocott variety. The citrus harvesting season typically ranges from February to September. Read the full report from the USDA-ForeignAgricultural Service HERE.

  • California Avocado Commission Referendum Announced

    California Avocado Commission Referendum Announced

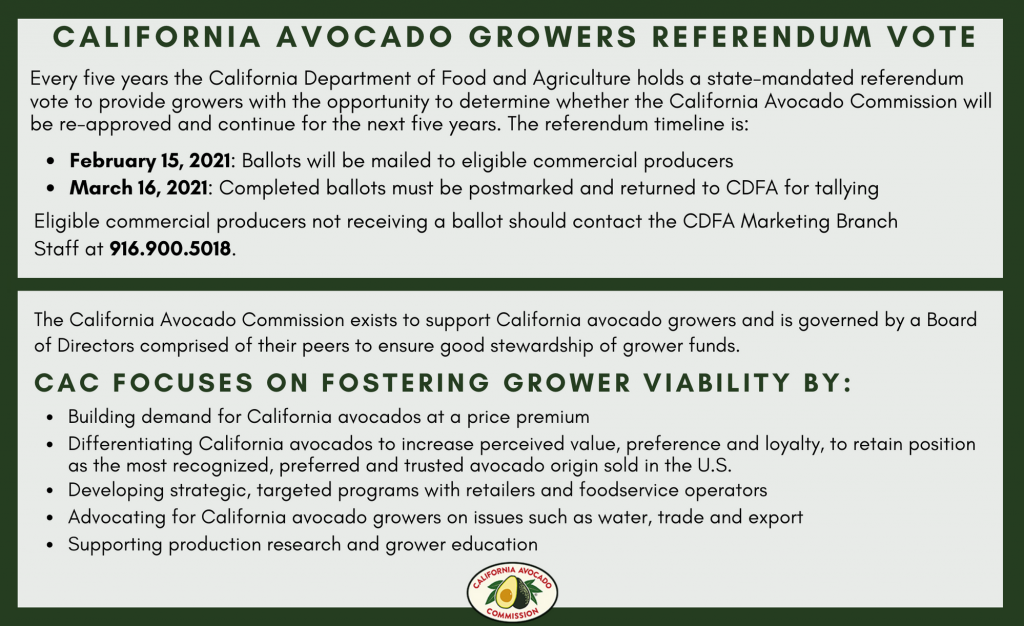
    Every five years the California Department of Food and Agriculture holds a state-mandated referendum vote to provide California avocado growers the opportunity to determine whether the California Avocado Commission will be reapproved to continue for the next five years.

    “The referendum process is a vital component of the law that established the California Avocado Commission,” said Rob Grether, chairman of the CAC board of directors. “It provides growers the opportunity to cast their vote on continuing the operations of the organization.”

    Ballots will be mailed to eligible California avocado commercial producers on February 15, 2021 and must be postmarked and sent to CDFA for tallying by March 16, 2021. Eligible commercial producers who do not receive a ballot should contact the CDFA Marketing Branch staff at 916-900-5018. Results are expected to be tallied by CDFA and announced no later than March 31, 2021.

    “The California Avocado Commission exists to support California avocado growers and is governed by a board of directors comprised of their peers to ensure good stewardship of grower funds,” said CAC President Tom Bellamore.

    The Commission focuses on fostering grower viability by building demand for California avocados at a price premium and increasing the fruit’s perceived value, preference and loyalty. About 70% of CAC’s current budget goes toward marketing, which includes developing strategic, targeted programs with retailers and foodservice operators. Other key activities include advocating for California avocado growers on issues such as water, trade and export, supporting production research and grower education.

    There have been eight reaffirming referenda since the establishment of the California Avocado Commission in 1978.

  • CA Olive Ranch Kicks Off New Year with Renewed Commitment to Consumer Transparency & Sustainability

    CA Olive Ranch Kicks Off New Year with Renewed Commitment to Consumer Transparency & Sustainability

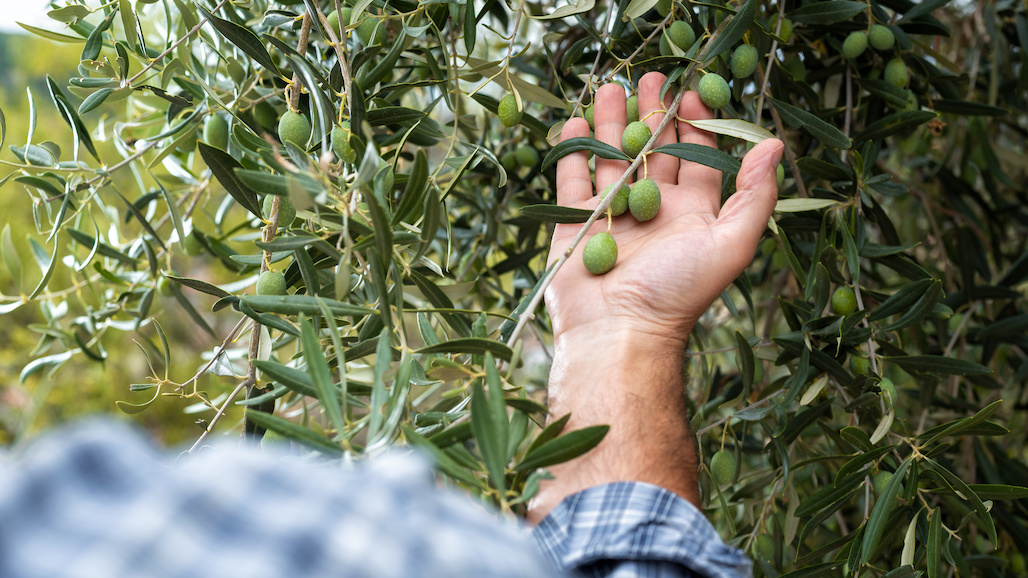
    California Olive Ranch (“COR”), the leading domestic grower of olives for extra virgin olive oil (“EVOO”) with the #1 bestselling product in the U.S. olive oil category, is ringing in the new year with the announcement of several exciting initiatives. Today, the company unveiled a new packaging design for its California Olive Ranch® brand and an innovative technology investment that reaffirms its commitment to consumer transparency. The company is also announcing the completion of one of the largest olive tree plantings in California in recent years and new environmental sustainability initiatives, including a commitment to regenerative agriculture and converting over 320,000 olive trees to organic production. Once complete, this will make COR one of the largest producers of certified organic 100% California EVOO.

    New California Olive Ranch® Brand Packaging a Reflection of Company Commitment to Transparency

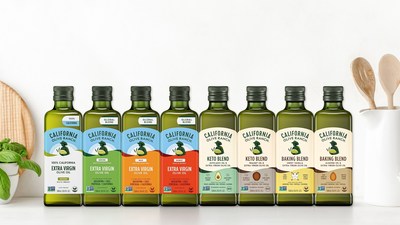
    A reflection of the company’s continued commitment to holding itself to a higher quality standard, the brand’s new, more modern looking labels help shoppers better understand the taste profile and flavor intensity of each product while also continuing to provide clear front-of-pack information on the different sources of EVOO across the company’s various 100% California and global blended product lines. “We are always pushing to help consumers understand what to expect from our diverse line of products,” said Michael Fox, CEO of COR, “Our labels were industry-leading in their transparency before and now with our new, more modern design are even more accurate, simple and clear.”

    The new labels, which will appear in stores over the next several months, encompass the full brand portfolio, including the 100% Californiaand 100% California Reserve collections, the Global Blend collection (formerly known as the Destination Series,) and a new culinary line that includes the company’s new Baking Blends and Keto Blends. New tasting notes and intensity cues were added to the products to give consumers additional assistance in understanding the flavor differences across the profiles. The company’s goal is to offer consumers an array of great-tasting options for every household looking to create delicious food with healthy, high-quality EVOO. “Our mission has always been to offer the highest quality extra virgin olive oil at an accessible price point,” said Fox. “All of our extra virgin olive oils are crafted to the California Department of Food and Agriculture Standard, which is the strictest olive oil standard for quality and purity in the world.”

    COR is also developing a new, industry-leading technology solution that will bolster its commitment to transparency even further.  Slated to roll out later this year, this new technology will give consumers even more insight into the source of the oil they purchased and the specific quality and purity certifications and attributes.  Additionally, the technology will help educate consumers on creative uses as well as the unique health benefits of each EVOO in the company’s portfolio.

    Committed to Environmental Sustainability and Growth of the California Olive Industry

    The company is proud to share its dedication to doing its part to advance the California olive oil industry and to help ensure there is a thriving planet for generations to come.  “We are committed to helping grow the California olive oil industry and are making investments across our organization to understand and apply the latest thinking in environmental sustainability to our farming practices,” said Fox. “We are also expanding our investments in regenerative agriculture to actively improve the condition of our natural resources, not just sustaining them.” Below is a brief highlight of the large initiatives the company is pursuing. The company’s first environmental impact report will be produced by the end of the year, providing more insight into these practices.

    • COR has stepped up its commitment to regenerative agriculture practices to further aid in carbon sequestration and soil health across all their acres. After successful trials, the company has rolled out regenerative soil practices like planting a diverse cover crop, no to minimal tilling, reusing tree trimmings and olive pomace in its compost, minimal mowing and inoculating soil with a proprietary microbe “compost tea” to increase soil life and health, and reducing/eliminating reliance on synthetic fertilizers. The company is partnering with leading California universities and state resource centers to further study and analyze the positive impact these practices will have on the soil health and environment.
    • COR has recently completed the planting of over two million olive trees in California with family-owned farms across the state. Not only does this increase the supply of California olives for olive oil, but research from the International Olive Council also indicates that olive trees could have a meaningful impact on sequestering carbon from the air.  COR has initiated its own research to better understand the positive benefits of the company’s modern farming and harvesting techniques in calculating its impact on California’s greenhouse gas emissions.
    • COR has started the transition of more than 320,000 olive trees to organic farming practices.  When the conversion is complete, COR would be one of the leading, if not the leading farmer of olives for USDA certified organic 100% California EVOO.About California Olive RanchFounded in 1998, California Olive Ranch advanced American olive oil by pioneering new ways of cultivating and harvesting olives to make their extra virgin olive oil both premium and affordable. Today, California Olive Ranch is the largest producer of extra virgin olive oil pressed from California grown olives. The company sells almost 40 products in more than 29,000 retail stores nationally. Its award-winning products are celebrated for their high quality by media, professional chefs and home cooks alike.  The company’s portfolio also includes the Lucini® brand of high-quality olive oil, vinegars and pasta sauces sourced almost exclusively from Italy.
  • Korea Remains a Steady Market for California Citrus

    Korea Remains a Steady Market for California Citrus

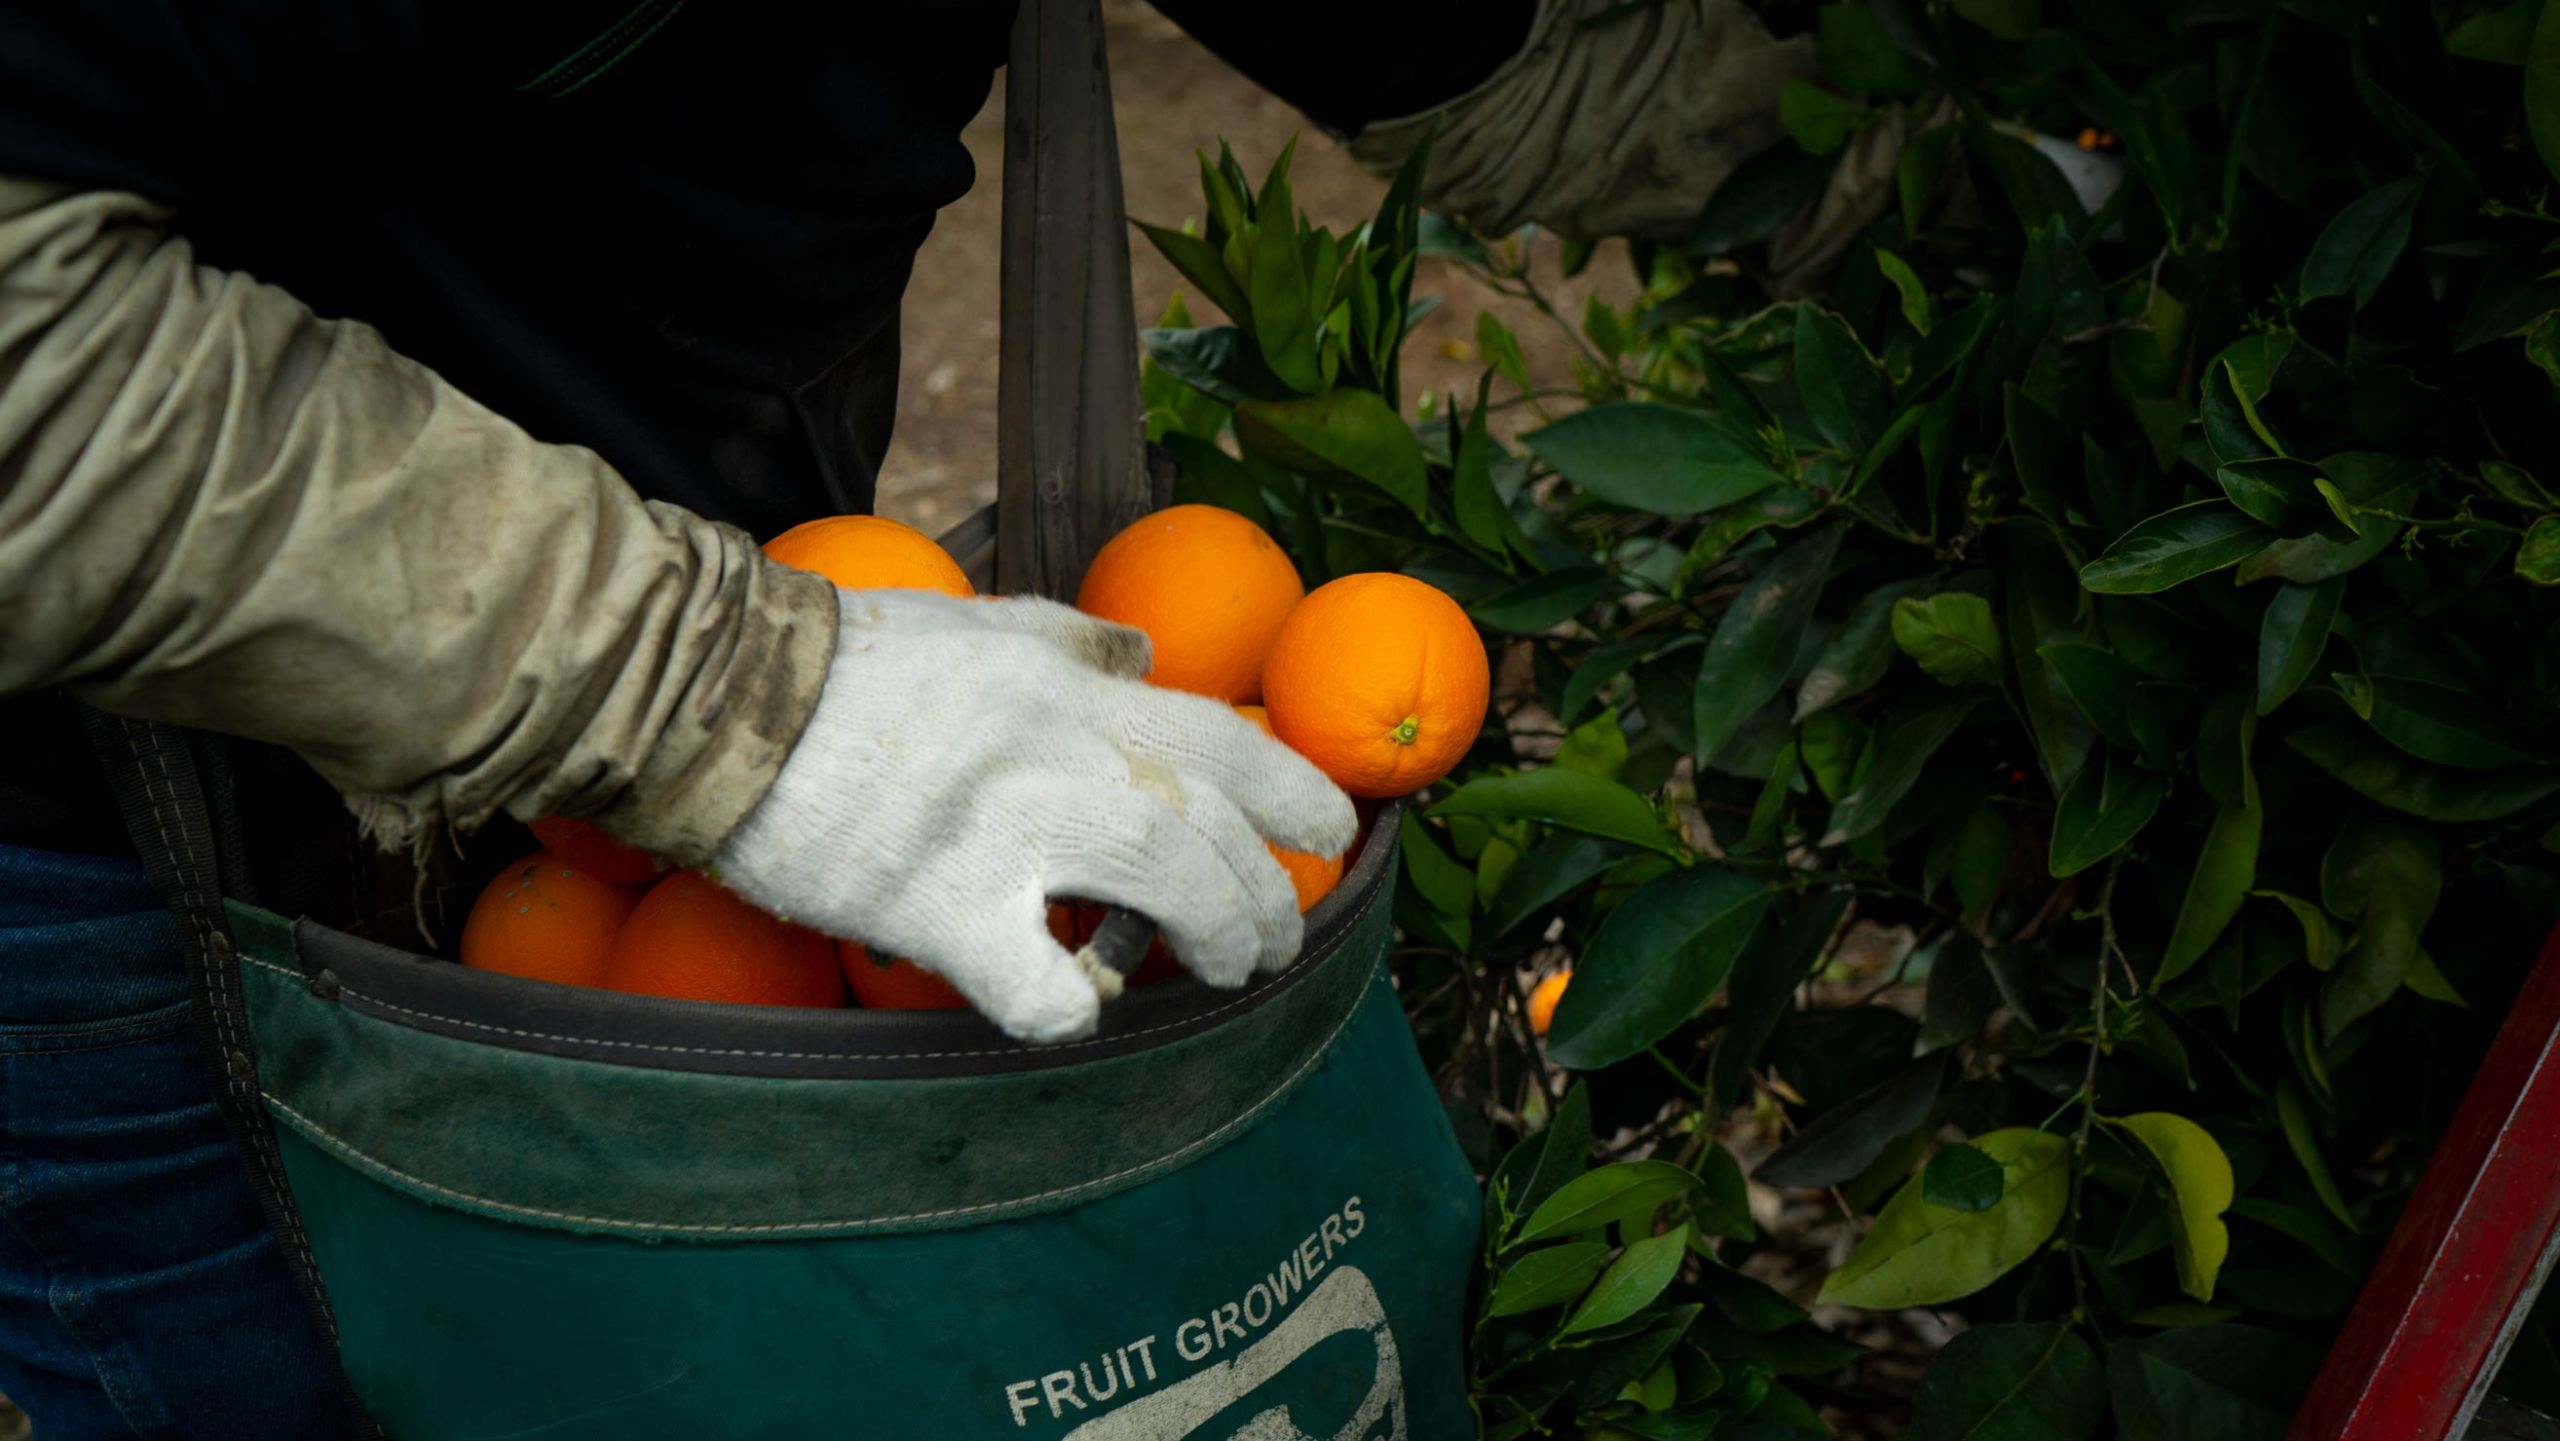
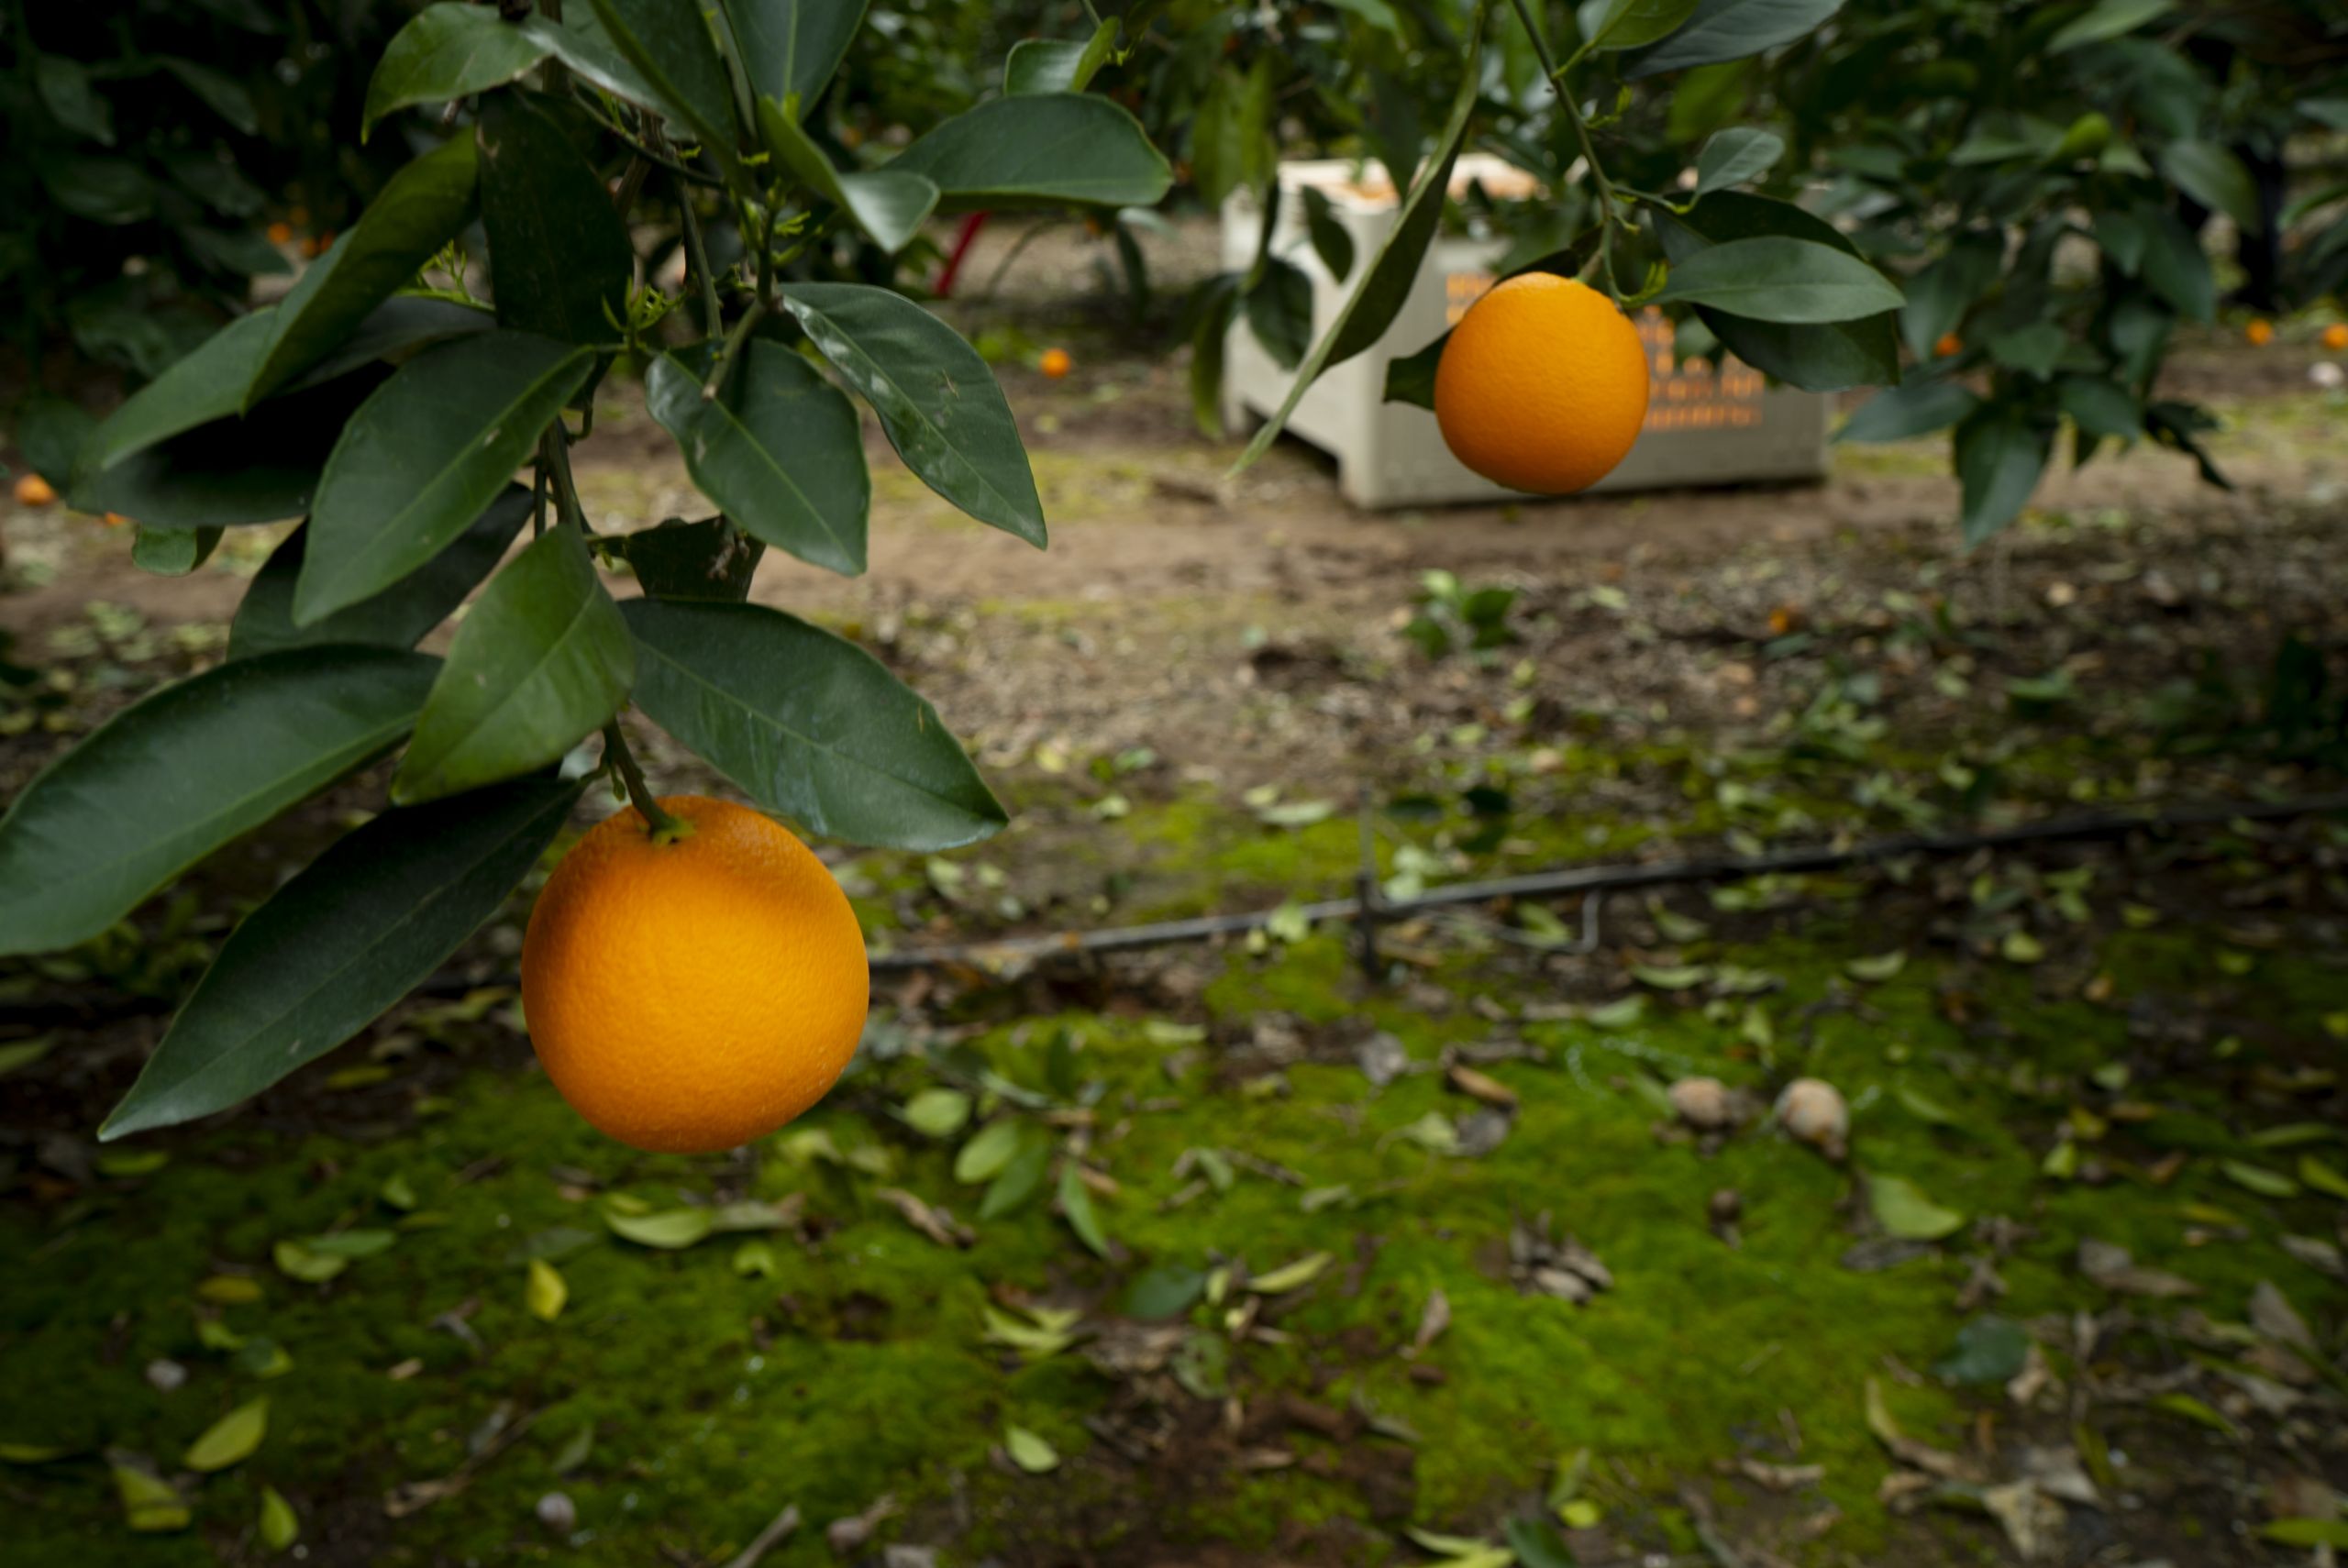
    Korea’s total citrus production for Marketing Year (MY) 2020/21 (October – September) is projected to reach 660,000 metric tons (MT). This 4.5 percent increase over MY 2019/20 volume is attributed to a larger open- field “Unshu” orange crop forecasted in the northern Jeju island growing region. Korea’s 2020/21 citrus consumption is projected to increase 2.9 percent to 567,000 MT due to increased marketing of quality citrus, and a 15 to 20 percent drop in availability of competing domestic fruit. Similar to last year’s trade, Korean fresh orange imports (primarily sourced from the United States) are forecast at 115,000 MT for MY 2020/21. Read the full report from the USDA-Foreign Agricultural Service HERE.

  • Egypt Maintains its Position as the World Leading Orange Exporter

    Egypt Maintains its Position as the World Leading Orange Exporter

    In marketing year (MY) 2020/21, FAS Cairo forecasts fresh orange exports to reach 1.5 million metric tons (MMT) up from 1.37 MMT in MY 2019/20. Post attributes the increase in exports to higher production amid favorable weather conditions. Saudi Arabia, Russia, the Netherlands, China, and United Arab Emirates are likely to remain Egypt’s top export destinations for oranges. Recent export destinations for Egyptian oranges include New Zealand, Japan, and Brazil. The COVID-19 pandemic caused a reduction in MY 2019/20 orange exports by 343,000 MT compared to the previous marketing year.

    Planted Area:

    In MY 2020/21, FAS Cairo forecasts total planted area in oranges at 168,000 hectares (ha), similar to the previous marketing year. MY 2019/20 planted area at 168,000 ha remains unchanged from the USDA official estimate. Most of the area planted with oranges is located in reclaimed lands which account for 60 percent of the total area. Plantations in the Nile Delta region account for 40 percent of the total orange planted area.

    Post estimates MY 2020/21 total harvested area at 145,000 ha, a 3.57 percent increase over last year. The increase in area harvested is attributed to a 7 percent increase in the number of bearing trees from the previous year in addition to favorable weather conditions during flowering time that positively impacted the flowering of the trees and hence the harvest as a result.

    Production:

    In MY 2020/21, FAS Cairo forecasts orange production to increase by 6.2 percent, or 200,000 MT to 3.4 MMT. Post attributes the increase in production to increase in harvested area and favorable weather conditions during the flowering time. Post is also revising the MY 2019/20 estimate upwards by 200,000 MT to 3.2 MMT from the USDA official projection of 3.0 MMT. We attribute the increase in production to higher yields on commercial farms.

    During the past couple of years, there has been an ongoing effort by the government, private associations and growers to replace old orchards with newer trees, improve on-farm irrigation techniques, adopting up-to date nutrient management programs, and reducing post-harvest losses.

    Orange is the major citrus species crop in Egypt, representing about 80 percent of the total cultivated citrus area. Egypt’s main orange varieties include the following:

    Washington Navel Orange: Washington Navel is the key cultivar navel orange grown in Egypt and the best-known naval orange being exported. There are other lesser known navel orange cultivars such as Navelate, Cara Cara, New Hall, Navelina, Fisher, Leng, Fukumoto and Lane late. Fruit color break starts in late September and ripening fruit dates extends from November to March. The fruit is seedless, medium to large-sized, with relatively rough skin in some cultivar and soft skin in others. It has a sweet flavor with a fruit taste. The rind is orange with dark pulp.

    Valencia Orange: Valencia ranks second after Navel oranges as far as area cultivated. Nubaria district is considered the largest production area for Valencia oranges in Egypt. Valencias have a long ripening season from March to July. The fruit pulp is juicy, it is medium to large-sized with round to oval shape. The skin is soft and easily peeled, the seeds are small, and the rind and flesh are orange.

    Other Varieties: There are other orange varieties like Baladi orange, Blood orange, Khalily orange, Yafawy oranges and Sweet orange. Cultivated areas of these varieties are small compared to Navel and Valencia orange, and they’re mainly consumed fresh or as juice.

    Consumption:

    In MY 2020/21, FAS Cairo forecasts that fresh oranges domestic consumption will increase by 4 percent to reach 1.55 MMT. Increase in local consumption is attributed to higher production, and increased utilization of fresh oranges by consumers amid the COVID-19 pandemic due to its high content of vitamin C. In MY 2020/21, utilization of oranges by the processing sector is forecast to grow by 4.4 percent from the previous marketing year as a result of the pandemic.

    Post is revising the MY 2019/20 fresh domestic consumption estimate upwards by 290,000 MT to 1.49 MMT from the USDA official projection of 1.2 MMT. We attribute the increase in consumption to higher demand by consumers amid the COVID-19 pandemic and an increase in orange processing from 300,000 MT to 335,000 MT due to increased demand for orange juice.

    The majority of orange exporters are producers and own packing facilities that are approved for export by the government. They also buy from local farmers if their production is not sufficient to meet their export obligations. Other exporters own packing facilities but do not produce oranges, and thus rely on local farmers. In these cases, the exporters are responsible for transporting the crop to their packing facilities.

    Trade:

    In MY 2020/21, FAS Cairo forecasts total exports to increase by 125,000 MT to reach 1.5 MMT. FAS Cairo attributes this increase to an anticipated higher production which will affect the export volume. Post is revising downward the estimates of fresh orange exports in MY 2019/20 to 1.37 MMT, compared to 1.7 MMT in MY 2018/19 as a result of the COVID-19 pandemic.

    The Central Administration for Plant Quarantine (CAPQ) of the Ministry of Agriculture and Land Reclamation (MALR) announced the beginning of the orange export season on December 1, 2020 for the MY 2020/21. The export season for oranges usually starts with shipments to the Arabian Gulf followed by Russia, Ukraine, and then to the European Union and East Asia. In MY 2019/20, Egyptian orange exports reached 104 countries with Saudi Arabia, Russia, the Netherlands, China, United Arab Emirates, Bangladesh, United Kingdom, Ukraine, Oman, and Malaysia remaining as Egypt’s top ten export destinations for oranges. Post expects that the top ten export destinations in MY 2020/21 will remain unchanged from MY 2019/20.  Read the full report from the USDA-Foreign Agricultural Service HERE.

  • Demand for Imported Citrus Softens in China

    Demand for Imported Citrus Softens in China

    In line with historical trends, fresh citrus production and consumption are forecast to continue upward in MY2020/21 to 35.6 MMT and 34 MMT, respectively. However, looking ahead, the rate of production growth is expected to slow as prices drop and consumer demand reaches its saturation point. Demand for imported citrus in MY2020/21 is expected to remain soft, down 25% overall from pre-COVID levels, though will return as the economy rebounds. Lower frozen concentrate orange juice imports and production show domestic industry challenges and signal consumers’ changing preferences to juices made from fresh fruits. Chinese countermeasures for COVID-19 will continue to add complication and cost to cold chain imports, including citrus. 

    Post forecasts total citrus production for marketing year (MY) 2020/21 will continue to grow because:

    • –  New trees planted 3-4 years ago start to produce more fruits.

    • –  New growing areas in various provinces.

    • –  New varieties are planted to replace the outdated ones.

    • –  Grafting and growing techniques shorten the time to bear fruits.

    • –  Increasing greenhouse planting for tangerines and mandarins.

      Despite the sustained growth, industry insiders speculate citrus production growth will slow in the next few years as the industry reaches what they believe to be the consumption saturation point.

      Prices: Overall citrus prices dropped in MY2019/20 with a larger crop. This downward pressure on prices will continue for MY2020/21 with an even larger crop forecasted. However, it is expected that the prices for premium fruits will remain high assuming the pandemic will be better controlled in MY2020/21 and Chinese consumers have stronger confidence in spending.

      The unprecedented surge and spread of COVID-19 in MY2019/20 had some key impacts on the Chinese citrus market:

    • –  The economic slowdown in 2020 made Chinese consumers more price sensitive and conservative in spending.

    • –  Major local citrus importers who purchased southern hemisphere products in early CY2020 encountered decreasing market demand and lost money, especially on imported oranges. As a result, for part of MY2019/20, they were hesitant to place further orders for imported fruits given the uncertainty of COVID-19 and challenges with trade.

    • –  Lockdowns and higher operational costs limited exports in MY2019/20, leaving more in the domestic market and creating downward pressure on prices.

    • –  Labor shortages and port backups in China and elsewhere had some negative impact on Chinese imports and exports in early CY2020.

    • –  Fewer imported fruits available in the wholesale market are leading some Chinese traders to put increasing attention on domestic fruit trade.

    • –  The disinfection measures required at Chinese ports for all cold chain food products starting in late MY2019/20 further raise the import costs.

    • –  Post believes consumers’ adoption of online and digital sales in the first half of 2020 will create lasting changes for offline retail stores.

    • –  Brand building, even in fruit, is becoming more important to attract high-end consumers.

    • –  The appreciation of the Chinese RMB in CY2019/20 will make it less expensive to import and more expensive to export possibly leaving more fruits in the domestic market. — Read the full report from the USDA Foreign Agricultural Service HERE.

  • Pandemic Conditions and Growing Vegetarian Population Increases Fresh Fruit Demand in India

    Pandemic Conditions and Growing Vegetarian Population Increases Fresh Fruit Demand in India

    India’s market year (MY) 2020/21 apple and pear production are estimated at 2.3 million metric tons (MMT) and 305,000 metric tons (MT), respectively, as unfavorable weather conditions during the flowering stage have led to reduced yields from MY 2019/20. Apple and pear imports for 2020/21 are forecast at 0.24 MMT and 22,500 MT, respectively. Table grape production is expected to marginally increase to 2.3 MMT, while Indian table grape exports are expected to decline, largely to meet domestic demand. Fresh deciduous fruit demand remains stable, and the COVID-19 pandemic that influenced consumer behavioral changes will continue to drive fruit consumption through both online and physical retail.

    Indian apple production is limited to the northern states of Jammu and Kashmir with a 70 percent market share, followed by Himachal Pradesh with 21.5-25 percent, and Uttarakhand with six percent share. The Northeastern hill states of Arunachal Pradesh, Nagaland, and Sikkim also produce small apple quantities. Read the full report from the USDA Foreign Agricultural Service HERE.

  • Argentina Lowers Export Taxes on Many Specialty Crops

    Argentina Lowers Export Taxes on Many Specialty Crops

    The Government of Argentina recently announced adjustments to export taxes on many specialty crops, including apples, pears, citrus fruits, blueberries, tomatoes, broccoli, cauliflower, nuts, and alfalfa intended to improve the international competiveness of these products.

    Argentine Government Seeks to Boost Exports of Specialty Crops:

    On Thursday, December 31, 2020 the Government of Argentina published Decree 1060/2020 which made adjustments to the export tax rates for many specialty crops as well as some manufactured goods. After several rounds of export tax changes in recent years the government is attempting to standardize export tax rates for many products at 0%, 3%, 4.5%, and 9% to avoid varying export tax rates among similar products. Previous export tax changes had given some products exchange-rate linked export taxes that had eroded in value as the Argentine peso devalued against the dollar.

    The stated rationale for the policy change is to encourage exports of added-value products and products whose increased production will result in higher levels of employment, and for which increasing exports won’t raise food costs. The government also hopes to encourage investment in these same sectors. Major structural issues such as high fixed operating costs, lack of investment, and currency controls have reduced Argentine competitiveness in many specialty crops over the years, so this measure will be limited in its capacity to boost exports in the short run. Most fruits and vegetables have had export tax rates lowered from 5% to a 0%.

    The list below, by HS Code Chapter, summarizes Annex 1 of Decree 1060/2020 where information on tax rates for specific products can be found. Export tax rates for most major field crops were unchanged, though the decree mentioned the need to adjust rates for certain commodities currently regulated by an expiring decree. Care should be taken to note if a specific HS code is listed in this decree or past decrees.

    Chapter 1 – Live Horses, Cattle, Primates, Dolphins, Pet Birds 9%;

    Chapter 2 Beef, Horse, Poultry Meat 9%; Sheep and Goat Meat 0%;

    Chapter 3 Various Fish – 9%; Tilapia, Trout, Carp 0%;

    Chapter 4 Fluid Milk 9%; Ultra High Temperature Milk, Yogurt, Butter, Cheese 4.5%; Honey 0%;

    Chapter 5 Semen & Embryos 4.5%;

    Chapter 6 Flowers and bulbs 4.5%;

    Chapter 7 Tomatoes, Cauliflower, Broccoli, Brussel Sprouts, Carrots, Cucumbers, Chickpeas, Beans, Asparagus, Eggplant, Celery, Peppers, Spinach, Artichokes, Olives, Pumpkins, Squash, Potatoes, Sweet Corn, Onions, Mushrooms, Garlic, Vegetable Seeds 0%;

    Chapter 8 Nuts, Plantains, Pineapples, Avocados, Mangos, Oranges, Mandarins, Clementines, Grapefruit, Lemons, Limes, Watermelon, Papayas, Apples, Pears, Quince, Sour Cherries, Peaches, Nectarines, Plums, Strawberries, Raspberries, Blueberries, Kiwis, Passionfruit, Persimmons 0%;

    Chapter 9 Coffee, Pepper, Vanilla, Cinnamon, Cloves, Nutmeg, Mace, Cardamom, Saffron, Turmeric 4.5%; Tea, Paprika, anise, cumin, coriander – -0%;

    Chapter 10 – “Other” Wheat, Rye, Barley, Corn, Oats, Sorghum – 12%; Grain seeds for planting, Buckwheat, Millet 4.5%; Quinoa 0 %

    Chapter 11 Malt 9%; Flaked Grains and Germs4.5%; Buckwheat flower 0%

    Chapter 12 Seeds of Soybeans, Peanuts, and Sunflowerseed for planting, Ginseng, Sugarbeets, Sugarcane 4.5%; Hops, Alfalfa pellets 0%

    Chapter 13 Various Gums, Saps, & Pectins 4.5%
    Chapter 14
    Bamboo, Vegetable Plaiting Materials 4.5%
    Chapter 15
    Glycerol 9%; Olive oil 0%;
    Chapter 16
    Sausages, Hams, Other Prepared & Preserved Meats, Sardines, Tuna 4.5%

    Chapter 17 Refined Beet & Cane Sugar, Glucose and Fructose Syrups, Non-Chocolate Confectionary 4.5%

    Chapter 18 Chocolate ingredients 4.5%
    Chapter 19
    Cereals, Pastas, Tapioca, Cuscus 4.5%

    Chapter 20 Pickled Cucumbers & Mushrooms, Preserved fruits and vegetables 4.5%; Preserved Peas, Olives, Tomatoes, Fruit Juices 0%

    Chapter 21 Coffee Extracts, Yeasts, Sauces, Food Preparations and Ingredients 4.5%; Tea & Yerba Mate Extracts 0%

    Chapter 22 Mineral Waters, Beer, Champagne, Wine, Liquor, Vinegar 4.5% Chapter 23 Livestock Feed 12%; Pet Food 4.5%
    Chapter 24
    Tobaccos 12%, Cigarettes & Cigars 4.5%
    Chapter 41
    Hides, skins, and leather 4.5%

    Chapter 51- Wool 4.5%, Yarn – 3.0%

    Chapter 52 Raw Cotton 12%; Carded Cotton and cotton waste 4.5%; Cotton thread and yarn 3.0%

    — By Benjamin Boroughs, USDA Foreign Agricultural Service

  • Argentina Lowers Export Taxes on Many Specialty Crops

    Argentina Lowers Export Taxes on Many Specialty Crops

    The Government of Argentina recently announced adjustments to export taxes on many specialty crops, including apples, pears, citrus fruits, blueberries, tomatoes, broccoli, cauliflower, nuts, and alfalfa intended to improve the international competiveness of these products.

    Argentine Government Seeks to Boost Exports of Specialty Crops:

    On Thursday, December 31, 2020 the Government of Argentina published Decree 1060/2020 which made adjustments to the export tax rates for many specialty crops as well as some manufactured goods. After several rounds of export tax changes in recent years the government is attempting to standardize export tax rates for many products at 0%, 3%, 4.5%, and 9% to avoid varying export tax rates among similar products. Previous export tax changes had given some products exchange-rate linked export taxes that had eroded in value as the Argentine peso devalued against the dollar.

    The stated rationale for the policy change is to encourage exports of added-value products and products whose increased production will result in higher levels of employment, and for which increasing exports won’t raise food costs. The government also hopes to encourage investment in these same sectors. Major structural issues such as high fixed operating costs, lack of investment, and currency controls have reduced Argentine competitiveness in many specialty crops over the years, so this measure will be limited in its capacity to boost exports in the short run. Most fruits and vegetables have had export tax rates lowered from 5% to a 0%.

    The list below, by HS Code Chapter, summarizes Annex 1 of Decree 1060/2020 where information on tax rates for specific products can be found. Export tax rates for most major field crops were unchanged, though the decree mentioned the need to adjust rates for certain commodities currently regulated by an expiring decree. Care should be taken to note if a specific HS code is listed in this decree or past decrees.

    Chapter 1 – Live Horses, Cattle, Primates, Dolphins, Pet Birds 9%;

    Chapter 2 Beef, Horse, Poultry Meat 9%; Sheep and Goat Meat 0%;

    Chapter 3 Various Fish – 9%; Tilapia, Trout, Carp 0%;

    Chapter 4 Fluid Milk 9%; Ultra High Temperature Milk, Yogurt, Butter, Cheese 4.5%; Honey 0%;

    Chapter 5 Semen & Embryos 4.5%;

    Chapter 6 Flowers and bulbs 4.5%;

    Chapter 7 Tomatoes, Cauliflower, Broccoli, Brussel Sprouts, Carrots, Cucumbers, Chickpeas, Beans, Asparagus, Eggplant, Celery, Peppers, Spinach, Artichokes, Olives, Pumpkins, Squash, Potatoes, Sweet Corn, Onions, Mushrooms, Garlic, Vegetable Seeds 0%;

    Chapter 8 Nuts, Plantains, Pineapples, Avocados, Mangos, Oranges, Mandarins, Clementines, Grapefruit, Lemons, Limes, Watermelon, Papayas, Apples, Pears, Quince, Sour Cherries, Peaches, Nectarines, Plums, Strawberries, Raspberries, Blueberries, Kiwis, Passionfruit, Persimmons 0%;

    Chapter 9 Coffee, Pepper, Vanilla, Cinnamon, Cloves, Nutmeg, Mace, Cardamom, Saffron, Turmeric 4.5%; Tea, Paprika, anise, cumin, coriander – -0%;

    Chapter 10 – “Other” Wheat, Rye, Barley, Corn, Oats, Sorghum – 12%; Grain seeds for planting, Buckwheat, Millet 4.5%; Quinoa 0 %

    Chapter 11 Malt 9%; Flaked Grains and Germs4.5%; Buckwheat flower 0%

    Chapter 12 Seeds of Soybeans, Peanuts, and Sunflowerseed for planting, Ginseng, Sugarbeets, Sugarcane 4.5%; Hops, Alfalfa pellets 0%

    Chapter 13 Various Gums, Saps, & Pectins 4.5%
    Chapter 14
    Bamboo, Vegetable Plaiting Materials 4.5%
    Chapter 15
    Glycerol 9%; Olive oil 0%;
    Chapter 16
    Sausages, Hams, Other Prepared & Preserved Meats, Sardines, Tuna 4.5%

    Chapter 17 Refined Beet & Cane Sugar, Glucose and Fructose Syrups, Non-Chocolate Confectionary 4.5%

    Chapter 18 Chocolate ingredients 4.5%
    Chapter 19
    Cereals, Pastas, Tapioca, Cuscus 4.5%

    Chapter 20 Pickled Cucumbers & Mushrooms, Preserved fruits and vegetables 4.5%; Preserved Peas, Olives, Tomatoes, Fruit Juices 0%

    Chapter 21 Coffee Extracts, Yeasts, Sauces, Food Preparations and Ingredients 4.5%; Tea & Yerba Mate Extracts 0%

    Chapter 22 Mineral Waters, Beer, Champagne, Wine, Liquor, Vinegar 4.5% Chapter 23 Livestock Feed 12%; Pet Food 4.5%
    Chapter 24
    Tobaccos 12%, Cigarettes & Cigars 4.5%
    Chapter 41
    Hides, skins, and leather 4.5%

    Chapter 51- Wool 4.5%, Yarn – 3.0%

    Chapter 52 Raw Cotton 12%; Carded Cotton and cotton waste 4.5%; Cotton thread and yarn 3.0%

    — By Benjamin Boroughs, USDA Foreign Agricultural Service