Category: Economics
-
Are Autonomous Self-Driving Tractors Legal in California?
As California’s agricultural industries progress towards a more sustainable future with new technologies and innovations, current Cal OSHA regulations (unless changed) may hinder their progress, particularly with regard to autonomous or self-driving tractors. Watch this brief video with Michael Miiller from the California Association of Winegrape Growers as he explains.Please thank this video’s sponsor Suterra for their industry support. -

Are Autonomous Self-Driving Tractors Legal in California?
As California’s agricultural industries progress towards a more sustainable future with new technologies and innovations, current Cal OSHA regulations (unless changed) may hinder their progress, particularly with regard to autonomous or self-driving tractors. Watch this brief video with Michael Miiller from the California Association of Winegrape Growers as he explains.Please thank this video’s sponsor Suterra for their industry support. -

Big Fresno Fair’s Seventh Annual San Joaquin Valley Olive Oil Competition Is Now Underway
Entries are now being accepted for the 7th annual San Joaquin Valley Olive Oil Competition (SJVOOC); Extra Virgin Olive Oil and Flavored Olive Oil entries from commercial producers in the State of California are eligible and olive oil must be made from producers’ most recent olive harvest. Deadline for entries is March 25, 2022.
“The San Joaquin Valley Olive Oil Competition continues to draw in the best of olive oil producers from throughout California – and we are honored to continue to showcase and recognize them – especially those from the Valley with our special ‘Best of the Valley’ award,” said Stacy Rianda, Deputy Manager of The Big Fresno Fair.
Participating producers must enter their harvest into one of two different classes: Extra Virgin Olive Oil and Flavored Olive Oil. Competition categories in the Extra Virgin Olive Oil class include: Spanish Blends (arbequina, arbosana, etc.); Spanish Singles; Italian Blends (ascolano, etc.); Italian Singles; Other Blends (picholine, barouni, etc.); Other Singles. Competition categories in the Flavored Olive Oil class include: Citrus; Herbal (rosemary; basil, etc.); Pepper (chile, jalapeno, habanero, etc.); and Other Flavors (garlic, truffle etc.).
Awards will be given out for Gold and Silver medals in each category, as well as one overall “Best of Show” in both the Extra Virgin Olive Oil category, Flavored Oil category and the “Best of the Valley” award. Judging will be evaluated and scored as follows:
- Gold Medal: Awarded to an olive oil that demonstrates its type and/or varietal character, balance, structure and complexities to the highest standards. Gold Medals will be awarded to those oils receiving scores between 86 – 100 points.
- Silver Medal: Awarded to an olive oil reflecting the correct distribution of balance and character of its type or variety; an oil deemed to be well crafted and of excellent quality. Silver Medals will be awarded to those oils receiving scores between 76- 85.99 points.
- Best of Show: Awarded to an olive oil recognized to possess special characteristics of the highest quality overall. All Gold Medal winners are eligible to compete for Best of Show in their division.
- Best of the Valley: Awarded to the oil that scored the highest with the ranch or office located in the San Joaquin Valley. Medals will be awarded for both EVOO and flavored oils. (Kern, Tulare, Kings, Fresno, Madera, Merced, Stanislaus and San Joaquin Counties eligible)
Producers may submit multiple entries under one category but may not submit a particular entry to more than one category. All entries must be available for commercial sale at the time of entry. Entries are due by March 25, 2022. Judging will be held on April 6, 2022 and winners will be announced on April 14, 2022 by 5:00 p.m.
Gold Medal, Best of the Valley and Best of Show winners will all have the opportunity to have a booth in the Wells Fargo Agricultural Building on one day during the 2022 Big Fresno Fair where they can taste, display and sell their award-winning product. Additionally, educational information will be set up so that Fairgoers can learn more about the art of making olive oil, its health benefits and more.
Each submission must include an entry form, at least two 250 ml bottles of the olive oil with retail labels attached and a $60 non-refundable fee per entry. Each entry must also contain a third-party chemical analysis in order to verify extra virgin status. Entries can be dropped off at The Big Fresno Fair Administration Office or can be shipped to SJVOOC – The Big Fresno Fair, 1121 S. Chance Ave. Fresno, CA 93702 no later than 4:30 p.m. on March 25, 2022. Any entry delivered by mail, freight or express must be prepaid. The Administration Office is open Monday through Friday from 8 a.m. to 4:30 p.m. for drop offs.
Last year, 55 entries from all throughout California were received. Below is a list of the Gold Medal Winners and Best of Show. For a complete 2021 winners list, go to: www.FresnoFair.com/SJVOOC.
Best Of Show
The Olive Press Sevillano (Sonoma and Yolo County)
Best of Show Flavored
Calivirgin Serrano (San Joaquin County)
Best of the Valley
Olivaia’s OLA Block X Heirloom (Tulare County)
Extra Virgin Olive Oils (EVOO)
Gold Medal Winners- Spanish Blends
Barton Olive Oil Co. EVOO (San Luis Obispo County) - Spanish Singles
Olive Crush Farms Arbequina (Calaveras County), Rosenthal Ranches Arbosana (Madera County), California Olive Ranch Arbosana (Glenn County), The Olive Press Sevillano (Sonoma and Yolo County), The Olive Press Picual (Sonoma and Yolo County), The Olive Press Arbosana (Sonoma and Yolo County), Organic Roots Arbequina (Glenn County), Calivirgin Premium EVOO (San Joaquin County), Mountain Springs Olive Ranch Arbequina (San Luis Obispo County), Corto Olive Co. Truly Arbosana (San Joaquin County) - Italian Blends
Tres Osos Robust (Monterey County), San Miguel Olive Farm Tuscan Gold Eleganza Elite (San Luis Obispo) - Italian Singles:
Tres Osos Taggiasca (Monterey County)
- Other Blends:
Rancho Azul y Oro Estate (Monterey County), Olivaia’s OLA Block X Heirloom (Tulare County)
- Other Singles
Mangini Ranch Mission (Calaveras County), Mountain Springs Olive Ranch Koroneiki (San Luis Obispo County)
Flavored Olive Oils
Gold Medal Winners- Pepper:
Calivirgin Serrano (San Joaquin County), Calivirgin Habanero (San Joaquin County)
- Citrus:
Enzo Organic Eureka Lemon Crush (Madera County), ENZO Organic Clementine Crush (Madera County)
- Herbal:
Calivirgin Bountiful Basil (San Joaquin County)
For more information about the San Joaquin Valley Olive Oil Competition (SJVOOC), including downloadable entry forms and deadlines, please visit www.FresnoFair.com/SJVOOC, email questions to srianda@fresnofair.com or call The Big Fresno Fair office at (559) 650-FAIR.
About The Big Fresno Fair:
The Big Fresno Fair, founded in 1884, is the fourth largest fair in the state of California and represents the 21st District Agricultural Association. More than 600,000 people from throughout the State visit The Big Fresno Fair each year making it the largest annual event in the Central Valley. Members of the Board of Directors include: Chuck Riojas, President; Terry Gonsalves, Vice President; Gary Chahil, Secretary/Treasurer; Linda Mae Balakian Hunsucker; Frank Flores; Jerry Pacheco; Annalisa Perea; Larry Serpa; and Lawrence Salinas. Deputy Managers, Stacy Rianda and Lauri King oversee the daily operations of the Fair. The 2022 Big Fresno Fair will run October 5-16. For more information about The Big Fresno Fair, please visit www.FresnoFair.com.
-

CA Prune Board Advances Study of Prunes and Bone Health
The California Prune Board (CPB) is leading the way in investigating a connection between prunes and favorable bone through a growing body of evidence spanning two decades. Building on this remarkable and extensive research, the organization is announcing recently published scientific data supporting the role prunes may play in optimal bone health, while previewing a pipeline of clinical trials currently underway.
“The science has shown us that something unique is going on with prunes, as we’ve uncovered some remarkable connections to bone health,” said Donn Zea, Executive Director, California Prune Board. “With every study we learn something more compelling further piquing our curiosity. Our research program has more to explore, and we’re excited to see where this takes us in terms of learning more about the benefits of prunes for bone health.”
RECENTLY PUBLISHED HIGHLIGHTS
In a recent review paper published in Advances in Nutrition titled, “The Role of Prunes in Modulating Inflammatory Pathways to Improve Bone Health in Postmenopausal Women,” researchers from Pennsylvania State University examined the relationship between prune consumption, oxidative stress, inflammation, and favorable bone health outcomes, summarizing the results of preclinical and clinical trials. They reported that the bone-protective effects of prunes found in postmenopausal women appear to be connected to the antioxidant and anti-inflammatory activity that prunes stimulate within the body. Moreover, the authors also suggested that prunes’ favorable effect on bone may be partially explained by changes in the gut microbiota that can come from regular prune consumption.
Additionally, in a USDA-funded clinical trial recently published in Nutrients, titled “The Short-term Effects of Prunes in Improving Bone in Men,” investigators from Florida State University sought to test the effect of daily prune consumption on bone metabolism in 35 men over the age of 50 who had some bone loss. The early findings showed a reduction in osteocalcin, a biomarker of bone turnover, and an increase in what’s known as the OPG:RANKL ratio, indicating prunes may have a positive effect on bone status after just three months of eating this whole fruit daily. These preliminary findings are a subset of a larger study with results that have not yet been published but are anticipated in the next 12-18 months.
“As a researcher it’s exciting to see a positive change in bone turnover in these men from prune consumption after a relatively short period of time. We anticipate even more favorable results in bone status once the men have completed a full year of eating prunes every day,” said Principal Investigator Bahram Arjmandi, PhD, RDN, Professor and Director, Center for Advancing Exercise and Nutrition Research on Aging, Florida State University.
RESEARCH UNDERWAY
In addition to this recently published data, the following nutrition studies from highly credentialed research institutions are currently in progress and working toward completion or journal publication:
Randomized Controlled Trial of Dietary Supplementation with Prunes on Bone Density, Bone Geometry, and Bone Strength in Postmenopausal Women
Principal Investigator: Mary Jane De Souza, PhD – Pennsylvania State University
With a cohort of over 200 postmenopausal women, this is the largest clinical trial to date to investigate the effect of prunes on bone status as a non-pharmaceutical plant-based strategy to combat bone breakdown.
The Effects of 12-months of Prune Consumption on Bone Mineral Density and Bone Turnover Markers in Korean Postmenopausal Women with Osteopenia
Principal Investigator: Peter Clifton, PhD – University of South Australia
Co- Principal Investigator: Yoona Kim, PhD, RD, Gyeongsang National University, Korea
This clinical trial in South Korea is the first study outside of the United States to investigate the bone protective benefits of daily consumption of prunes in Korean osteopenic postmenopausal women.
The Impact of Consuming California Prunes on Bone Health of Young Women Using Hormonal Contraceptives
Principal Investigator: Shirin Hooshmand, PhD, RD – San Diego State University
The study is investigating the impact of prune consumption on bone formation and in preventing or slowing bone loss in young women 18-25 years old taking hormonal contraceptives.
“Bone health, whether optimizing bone formation early in life or preventing bone loss in adulthood, is critical at all life stages given that the human skeleton is dynamic, undergoing a continuous cycle of building and breaking down bone,” said Andrea N. Giancoli, MPH, RD, Nutrition Advisor, California Prune Board. “We are aiming to better understand the role of prunes in this cycle that is strongly correlated to gut health, inflammation, and oxidative states within the body.”
While it remains unclear what bioactive compounds in prunes are responsible for the beneficial effects on bone, the prune-positive bone health story may be partially due to the array of vitamins and minerals in California Prunes known to influence bone status, namely boron, potassium, copper and vitamin K. Prunes are also rich in phenolic compounds, which research suggests may inhibit bone breakdown and stimulate bone formation. Key future directions to bridge the gap in the areas of bone and the gut-bone axis are on the research horizon.
CREATING A VISION FOR THE FUTURE
Advancing bone-focused nutrition research and expanding the connection to the gut-bone axis, while also exploring clinical trials in various life stages and international populations is at the heart of the California Prune Board’s strategic vision for continued research into the next decade.
The integrity of the California Prune Board’s nutrition research program is demonstrated by the renowned research and academic institutions with whom it has partnered and the rigorous process that ensures credible research decisions.
A top-caliber nutrition research advisory panel, led by Mary Jo Feeney, MS, RDN, FADA, FAND, helps to guide these California Prune nutrition research efforts. The panel is comprised of highly experienced researchers and nutrition experts from academic institutions, including Tufts University, Cleveland Clinic, Pennsylvania State University, University of Minnesota, and San Diego State University. This independent advisory panel provides vision and oversight of the nutrition research program and ensures scientific rigor for every project that explores the nutritional and health benefits of California Prunes.
The California Prune Board is deeply committed to the scientific rigor of nutrition research. For more details on previously published research, visit: https://californiaprunes.org/healthy-living/benefits-of-prunes/additional-research/
REFERENCES
Damani JJ, De Souza MJ, VanEvery HL, Strock NCA, Rogers CJ. The Role of Prunes in Modulating Inflammatory Pathways to Improve Bone Health in Postmenopausal Women. Adv Nutr. 2022 Jan 3:nmab162. Epub ahead of print.
George KS, Munoz J, Ormsbee LT, Akhavan NS, Foley EM, Siebert SC, Kim JS, Hickner RC, Arjmandi BH. The Short-Term Effect of Prunes in Improving Bone in Men. Nutrients. 2022 Jan 10;14(2):276.
ABOUT THE CALIFORNIA PRUNE BOARD
The California Prune Board was established in 1952 to represent growers and handlers under the authority of the California Secretary of Food and Agriculture. California is the world’s largest producer of prunes with orchards across 14 counties in the Sacramento and San Joaquin valleys. Promoting a lifetime of wellness through the enjoyment of California Prunes, the organization leads the premium prune category with generations of craftsmanship supported by California’s leading food safety and sustainability standards.
-

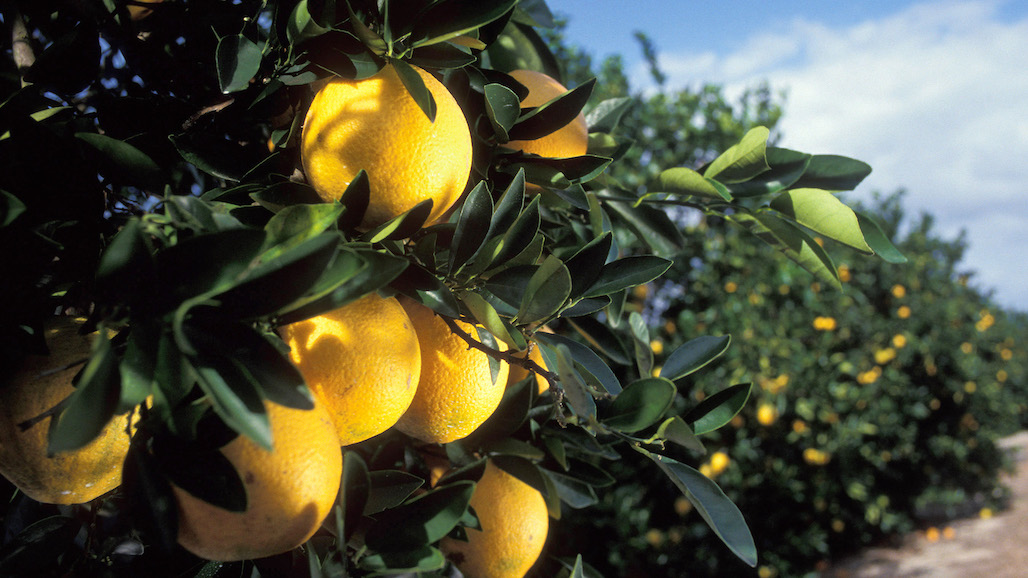
Despite Production Challenges, Egypt to Continue as World’s Largest Fresh Orange Exporter
The USDA Foreign Agricultural Service (FAS) in Cairo anticipates Egypt to maintain its position as the number one orange exporter in MY 2021/22 despite production challenges. In marketing year (MY) 2021/22, FAS Cairo forecasts fresh orange exports to reach 1.45 million metric tons (MMT) down from 1.67 MMT in MY 2020/21. Post attributes the decrease in exports to lower production amid unfavorable climate conditions. Russia, Saudi Arabia, Netherlands, India, Bangladesh, United Arab Emirates, China, United Kingdom, Ukraine, and Oman are likely to remain Egypt’s top ten export destinations for fresh oranges.
Planted Area:
In MY 2021/22, FAS Cairo forecasts total planted area in oranges at 168,000 hectares (ha), similar to the previous marketing year. MY 2020/21 planted area at 168,000 ha remains unchanged from the USDA official estimate. Most of the area planted with oranges is located in desert reclaimed lands which account for 70 percent of the total area. Plantations in the Nile Delta region account for 30 percent of the total orange planted area.
Post estimates MY 2021/22 total harvested area at 135,000 ha, a 6.9 percent decrease from last year. The decrease in area harvested is attributed to an approximately 7.2 percent decrease in the number of bearing trees from the previous year due to unfavorable weather conditions during flowering time that negatively impacted fruit set, and hence the harvest as a result.
Production:
In MY 2021/22, FAS Cairo forecasts orange production to decrease by almost 16 percent, or 570,000 MT to 3 MMT. The decrease in production is attributed to severe weather conditions and fluctuating temperatures during flowering of the trees which impacted fruit set and production. Orange production in the Nile Delta was also impacted by a 25-30 percent increase in fertilizer prices due to higher costs of production and larger exports by the fertilizer industry to capture higher prices in the global market. Typical land ownership in the Nile Delta is an acre or less.
Post is also revising the MY 2020/21 estimate upwards by 170,000 MT to 3.57 MMT from the USDA official projection of 3.4 MMT. We attribute the increase in production to higher yields and favorable weather conditions last season during the flowering time that positively impacted fruit set and hence the production as a result.
Most of Egypt’s orange production come from commercial farms on reclaimed desert land established during the last three decades, rather than the Nile Valley where land ownership is fragmented and farmers cannot afford the necessary level of investment for sustainable orange production. Despite these challenges, replacing old orchards with newer trees, improving on-farm irrigation techniques, adopting up-to date nutrient management programs, and reducing post-harvest losses are ongoing efforts by growers associations and the government.
Orange is the major citrus crop in Egypt, representing about 80 percent of the total cultivated citrus area. Egypt’s main orange varieties include the following:
Washington Navel Orange: Washington Navel is the key cultivar navel orange grown in Egypt and the best-known naval orange being exported. There are other lesser known navel orange cultivars such as Navelate, Cara Cara, New Hall, Navelina, Fisher, Leng, Fukumoto and Lane late. Fruit color break starts in late September and ripening fruit dates extend from November to March. The fruit is seedless, medium to large-sized, with relatively rough skin in some cultivar and soft skin in others. It has a sweet flavor with a fruit taste. The rind is orange with dark pulp.
Valencia Orange: Valencia ranks second after Navel oranges as far as area cultivated. Nubaria district is considered the largest production area for Valencia oranges in Egypt. Valencias have a long ripening season from March to July. The fruit pulp is juicy and it is medium to large-sized with a round to oval shape. The skin is soft and easily peeled, the seeds are small, and the rind and flesh are orange.
Other Varieties: There are other orange varieties like Baladi orange, Blood orange, Khalily orange, Yafawy oranges and Sweet orange. Cultivated areas of these varieties are small compared to Navel and Valencia orange, and they’re mainly consumed fresh or as juice.
Consumption:
In MY 2021/22, FAS Cairo forecasts that fresh oranges domestic consumption will decrease by 19.3 percent to reach 1.25 MMT. Decrease in local consumption is attributed to lower production and more growers directing their produce towards exports as worldwide orange demand is on the rise. Globally, consumers have increased their utilization of fresh oranges amid the COVID-19 pandemic due to its high vitamin C content.
In MY 2021/22, utilization of oranges by the processing sector is forecast to decrease by approximately 14.3 percent from the previous marketing year as a result of the anticipated lower fresh orange production and higher costs of the processing sector production and transportation which is reflected in consumer prices. MY 2020/21 fresh domestic consumption and processing estimates remains unchanged from the USDA official estimate.
Trade:
In MY 2021/22, FAS Cairo forecasts orange exports to decrease by approximately 13.2 percent to reach 1.45 MMT. We attribute this decrease to anticipated lower production which will affect the export volume. FAS Cairo anticipates Egypt to maintain its position as the number one orange exporter in MY 2021/22, despite production challenges due to severe climate conditions.
Post is revising upward the estimates of fresh orange exports in MY 2020/21 to 1.67 MMT from the USDA official estimate of 1.5 MMT.
Post attributes this increase in exports to higher production, more growers linked to international markets and a rise in global prices amid increased consumer demand.
The majority of orange exporters are producers and own packing facilities that are approved for export by the government. They also buy from local farmers if their production is not sufficient to meet their export obligations. Other exporters own packing facilities but do not produce oranges, and thus rely on local farmers. In these cases, the exporters are responsible for transporting the crop to their packing facilities.
The Central Administration for Plant Quarantine (CAPQ) of the Ministry of Agriculture and Land Reclamation (MALR) and the Agricultural Export Council (AEC) have agreed to start the orange export season on December 15, 2021 for the MY 2021/22. The export season for oranges usually starts with shipments to the Arabian Gulf followed by Russia, Ukraine, and then to the European Union and East Asia.
In MY 2020/21, Egyptian orange exports reached 111 countries compared to 104 countries in MY 2019/20 with Russia, Saudi Arabia, Netherlands, India, Bangladesh, United Arab Emirates, China, United Kingdom, Ukraine, and Oman as Egypt’s top ten export destinations for oranges. Post expects that the top ten export destinations in MY 2021/22 will remain unchanged from MY 2020/21 (Figure 1).
Figure 1: Top Ten Markets for Egypt’s Fresh Orange Exports

Successful joint efforts by the Egyptian government and the private sector to open new markets such as New Zealand, Brazil, and Japan and other markets over the last few years – will increase orange exports. These joint efforts have also contributed to the application of a modernized tracking systems for oranges exports during the stages of cultivation, production, packaging and export.
The success of Egypt’s export policy in opening new markets and establishing a traceability system have contributed to Egypt being the top orange exporter in the world during the past 5 years with a total volume of 8.32 MMT. All of these developments support a positive outlook for Egyptian orange exports as well as encouraging agribusinesses to invest in establishing new facilities or expanding capacity.
Egypt’s exports of fresh oranges to its top ten destinations in MY 2020/21 amounted to 1.27 MMT compared to 1.06 MMT in MY 2019/20, an increase of almost 20.5 percent. In MY 2020/21, Egypt’s fresh orange exports to the top ten destinations constituted 75 percent of total exports compared to 77 percent of total exports in MY 2019/20.
Metric Tons
This drop is due to a smaller overall export volume in MY 2019/20 (1.37 MMT) compared to 1.67 MMT of fresh orange exports in MY 2020/21. It is also reflected in higher export volumes to key markets as well as exploring new export ones.
In MY 2020/21, the most significant increase in Egypt’s fresh orange exports were to India with a more than threefold increase compared to the previous marketing year due to higher demand by Indian consumers amid the COVID-19 pandemic. Exports to Bangladesh have also increased a great deal, by 75 percent. Exports to Russia increased by 15 percent and Egyptian orange exports to Saudi Arabia have also increased, by 6 percent. Exports to the Netherlands increased by 11 percent in MY 2020/21 compared to MY 2019/20.
In contrast, Egyptian orange exports to the Chinese market dropped by roughly 32 percent in MY 2020/21 compared to the previous marketing year due to inflated freight prices.
Marketing:
Russia: Turkey and South Africa are Egypt’s main competitors in the Russian market. However, Egypt’s total exports to Russia in CY 2021 (Jan-Sep) was at 238,560 MT exceeding both origins by a wide margin – South Africa at 36,929 MT and Turkey shipped 34,822 MT. Egypt’s total exports to Russia in CY 2020 was at 211,113 MT, also exceeding both origins by a wide margin – Turkey at 112,353 MT and South Africa shipped 77,045 MT. (Source: Trade Data Monitor, LLC)
Saudi Arabia: Egypt’s main competitors in the Saudi Arabian market are traditionally South Africa, Spain, and Lebanon. In CY 2021 (Jan-Sep), Egypt’s exports of fresh oranges to the Saudi Arabian market amounted to 245,569 MT exceeding the three origins by wide margins. South African exports amounted to 61,740 MT, Spain’s exports at 10,788 MT, followed by Lebanese fresh orange exports at 8,380 MT. In CY 2020, Egypt was also the leading exporter to Saudi Arabia with a total of 254,486 MT versus 89,373 MT exported by South Africa. followed by Lebanon at 24,358 MT, and Spain at 15,348 MT. (Source: Trade Data Monitor, LLC)
EU- 28: Egypt’s main competitors in the European Union are South Africa and Morocco. In CY 2020, South Africa exported 453,745 MT versus 211,697 MT exported by Egypt followed by Morocco at 74,864 MT. In CY 2021 (Jan-Aug), Egypt’s exports of fresh oranges to the European Union have increased by 22 percent compared to the same period in CY 2020 amounting to 308,384 MT, and exceeding South Africa which shipped 158,932 followed by Morocco at 45,454 MT. (Source: Trade Data Monitor, LLC)
India: South Africa is Egypt’s competitor in this market. In CY 2020, Egyptian exports amounted to 26,665 MT while South Africa supplied 11,000 MT to the Indian Market. In CY 2021 (Jan-Sep), Egypt’s exports of fresh oranges to India amounted to 126,271 MT exceeding the South African origin by wide margins. In CY 2021 (Jan-Sep), South Africa shipped only 12,179 MT to India. (Source: Trade Data Monitor, LLC).
Bangladesh: Egypt’s main competitor in the Bangladeshi market are mainly India and South Africa. In CY 2021 (Jan-Sep), Egypt’s exports of fresh oranges to Bangladesh amounted to 107,000 MT, India at 62,531 MT and South African exports amounted to 40,127 MT. In CY 2020, India was the leading
exporter to Bangladesh with a total of 127,914 MT versus 66,000 MT exported by South Africa and another 66,000 MT exported by Egypt. (Source: Trade Data Monitor, LLC)
China: South Africa is Egypt’s main competitor in this market. In CY 2020, Egyptian exports to the Chinese market amounted to 112,373 MT while South Africa supplied 105,000 MT. In CY 2021 (Jan- Sep), Egypt’s exports of fresh oranges to the Chinese market amounted to 86,130 MT, and South African exports amounted to 66,861 MT. (Source: Trade Data Monitor, LLC)
United Arab Emirates: In CY 2020, South Africa exported 89,527 MT versus 138,611 MT exported by Egypt. In CY 2021 (Jan-Aug), Egypt’s exports of fresh oranges to the UAE market amounted to 49,432 MT, and South African exports amounted to 76,420 MT (Source: Trade Data Monitor, LLC).
United Kingdom: Egypt’s competitors in the UK market are mainly Spain and South Africa. In CY 2021 (Jan-Sep), Egypt’s exports of fresh oranges to the United Kingdom amounted to 64,000 MT, Spain at 66,000 MT, and South African exports amounted to 45,386 MT. In CY 2020, Spain was the leading exporter to the United Kingdom with a total of 93,500 MT versus 67,800 MT exported by South Africa, followed by Egypt which shipped 55,217 MT to the UK market. (Source: Trade Data Monitor, LLC)
Ukraine: In CY 2020, Egyptian exports to Ukraine amounted to 41,600 MT while Turkey supplied 30,639 MT. In CY 2021 (Jan-Sep), Egypt’s exports of fresh oranges to the Ukrainian market amounted to 48,192 MT and Turkish exports amounted to 5,291 MT, a 70 percent decline compared to the same period in CY 2020. (Source: Trade Data Monitor, LLC)
Oman: In CY 2020, Egypt exported 35,770 MT to Oman versus 13,171 MT exported by South Africa. In CY 2021 (Jan-Sep), Egypt’s exports of fresh oranges to Oman amounted to 35,000 MT, and South African exports amounted to 10,000 MT (Source: Trade Data Monitor, LLC). — By Ahmed Wally, USDA Foreign Agricultural Service

-

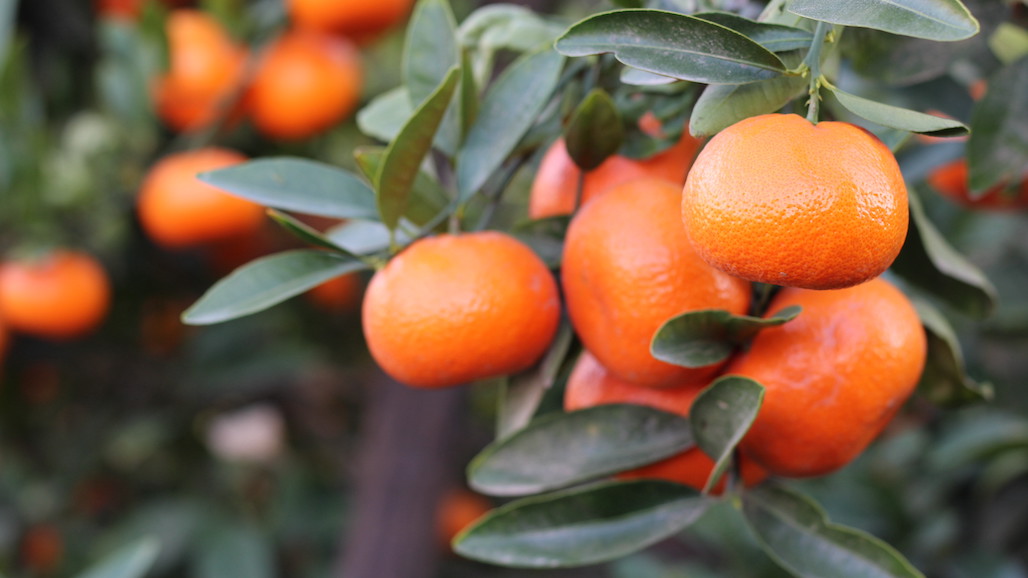
Challenges for the Japanese Citrus Market
Japan’s mandarin production continues to decline amidst labor shortages and reduced consumption. Shipping challenges and rising prices are projected to reduce the consumption of largely imported oranges and grapefruit. FAS/Tokyo anticipates that the resumption of hotel and restaurant operations following 2020-2021 COVID-19-related states of emergency will support the recovery of the Japanese demand for fresh lemons.

Production
Japan’s domestic tangerine/mandarin production primarily focuses on Satsuma mandarins, also known as “Unshu mikan” or “Unshu orange” (referred to as “unshu” hereafter). After reaching peak production of 3.7 million metric tons (MT) and a corresponding price drop in 1975, Japan’s unshu production has been steadily declining in line with production plans by Japan’s Ministry of Agriculture, Forestry and Fisheries (MAFF). In response, some citrus farmers have transitioned to producing non-unshu varieties (e.g., Natsu-Mikan (Citrus natsudaidai) and Iyokan (Citrus Iyo)). Although this transition had partially offset falling unshu production, non-unshu production has also been declining since 1987 due to the overarching challenge in Japanese agriculture of aging farmers and a lack of successors.
In marketing year (MY: October – September) 2021/22, FAS/Tokyo forecasts area harvested for tangerines/mandarins in Japan will shrink by 1,300 hectares (ha) to 50,400 ha from MY 2020/21. The unshu varieties will represent approximately 80 percent of Japan’s total tangerine/mandarin production, and the remainder will be non-unshu varieties.
Japan’s tangerine/mandarin season runs generally between October and May, where unshu production occurs primarily between October to February, followed by non-unshu varieties. According to MAFF statistics, five western prefectures (Wakayama, Ehime, Shizuoka, Kumamoto, and Nagasaki) produce nearly 70 percent of Japan’s unshu. These five prefectures are also major producers of non-unshu varieties. Until MY 2019/20, MAFF had set an “appropriate production/distribution quantity” target to control production, but recent unshu production fell short of the targets. Therefore, MAFF decided to shift away from government-driven production control. For MY 2021/22, MAFF announced a tangerine/mandarin demand estimate in an effort to balance production with market demand.
MAFF’s MY 2021/22 demand estimate for unshu is 760,000 MT, 6,000 MT down from MY 2020/21. However, based on industry sources, FAS/Tokyo forecasts Japan’s MY 2021/22 production will fall short of meeting that demand. According to Wakayama unshu farmers, MY 2021/22 will be an “off– year” for the alternatively bearing unshu in Wakayama and Shizuoka prefectures. Furthermore, long rains in May and August negatively impacted production due to increased incidence of Botrytis cinerea and citrus black spot disease. FAS/Tokyo forecasts MY 2021/22 tangerine/mandarin production at 924,000 MT, down 5.3 percent from MY 2020/21 level, of which 720,000 MT will be unshu.
Consumption
Approximately 90 percent of domestically produced tangerines/mandarins are consumed fresh in Japan. The remainder is processed, mostly for juice. According to surveys carried out by the Japan Fruit Association (JFA) and the Japan Co-operative Alliance (JCA), price is increasingly the key consideration for Japanese consumers in purchasing fresh fruit. For example, the 2020 JFA survey found that approximately 55 percent of Japanese consumers eat fresh fruit less than once a week due to cost. Although at-home food consumption, where tangerines/mandarins are typically eaten, has increased during the COVID-19 pandemic, this trend has not led to an increase in fresh fruit consumption. Consequently and in light of the expected decline in domestic tangerine/mandarin production, FAS/Tokyo forecasts Japan’s total tangerine/mandarin consumption will decrease by 5.0 percent from MY 2020/21 to 949,000 MT in MY 2021/22.
Imports
In MY 2020/21, Japan’s imports of fresh tangerines/mandarins rose by 9.9 percent to 23,103 MT, primarily due to summer tangerine imports from Peru (Table 1), which gained market access to Japan for tangerines/mandarins in 2018. Although Peruvian tangerines are typically more price-competitive than U.S. or Australian products, there is minimal overlap or direct competition in the Japanese market between tangerine/mandarin imports from the United States and southern hemisphere. Nevertheless, despite remaining the top fresh tangerine/mandarin supplier to Japan, the U.S. import share has been declining in the last few years due to changing production patterns and export priorities in the United States, as well as increasing price (Table 1).
FAS/Japan forecasts Japan’s imports of tangerines/mandarins to increase to 25,000 MT in MY 2021/22 or by 8.2 percent from MY 2020/21 levels, largely due to growing consumption in the summer months driven by the availability of Australian and Peruvian products.

Exports
Despite COVID-19-related restrictions on travel and promotional activities, Japan’s fresh tangerine/mandarin exports increased to 1,416 MT or by 34.4 percent from MY 2019/20 to MY 2020/21 largely due to greater demand from established customers in Hong Kong. Given the Government of Japan’s focus on boosting agricultural exports, including unshu (see JA2021-0103 titled “Japan Releases Details on Agricultural Export Expansion Plan”), FAS/Tokyo forecasts MY 2021/22 Japan’s tangerine/mandarin exports will grow to 1,800 MT or by 27 percent from MY 2020/21 levels.
Policy
U.S. tangerine/mandarin exports (Harmonized System Code (HS) 0805.21, clementines (HS 0805.22) and similar varieties (HS 0805.29)) continue to face a tariff disadvantage compared to tangerines/mandarins from member countries, including Australia and Peru, of the Comprehensive and Progressive Agreement for Trans-Pacific Partnership (CPTPP). The import tariff rate for CPTPP tangerines/mandarins is 5.6 percent, while U.S. products face a 17 percent tariff. Read the full report from the USDA Foreign Agricultural Service HERE.
-

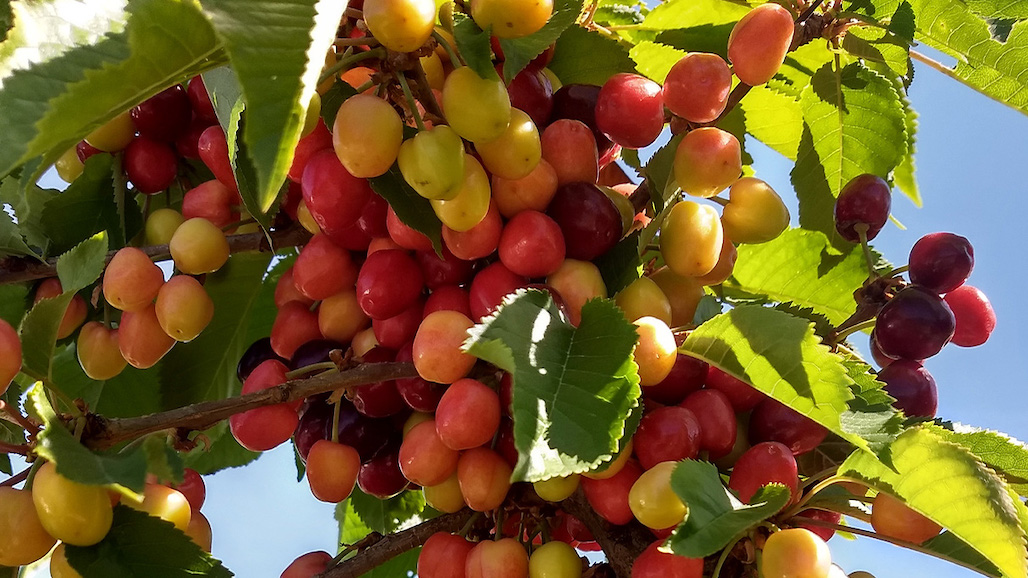
Grant to Support Affordable Testing to Fight Little Cherry Disease
Washington State University (WSU) will help cherry growers test more trees for the damaging Little Cherry Disease thanks to a Washington State Department of Agriculture Specialty Crop Block Grant received by the Washington State Tree Fruit Association.
Named for its most distinct symptom—small, colorless fruit—what growers call ‘Little Cherry’ is a simultaneous outbreak of Little Cherry virus-2 and the X-disease phytoplasma, both of which produce similar symptoms on infected cherry trees and are difficult to tell apart, even by experts. This is more difficult because symptoms are usually noticed only a few weeks before harvest.
The pathogens are spread in orchards by small insects: the virus by mealybugs, and the phytoplasma by leafhoppers.
Tests are available for growers to learn if a tree is infected, but they can be expensive. The new three-year, $530,000 grant will help to expand testing capacity at WSU’s Plant Disease Diagnostic Lab in Pullman with more equipment and supplies. This support will reduce testing fees by approximately 50%, to $50 per test.
“Affordable and available testing is a key element of our industry’s response to Little Cherry Disease” said Jon DeVaney, WSTFA President. “Washington’s cherry growers appreciate the support of the WSDA Specialty Crop Block Grant Program and WSU’s Plant Disease Diagnostic Lab in this effort.”
“Active, aggressive tree removal is the best way to suppress this outbreak and prevent further spread, and testing is an essential tool to identify trees in the early stages of infection,” said Scott Harper, WSU virologist and director of the Clean Plant Center Northwest. “It will help growers make informed management decisions for their orchards.”
Harper’s lab supported the initial wave of testing in 2018-2019, and commercial labs took over testing in 2020, but few growers could afford to test every tree that they suspected might be infected.
“WSU and collaborating laboratories are working hard to provide growers with Little Cherry testing services,” said Tianna DuPont, a WSU Tree Fruit Extension Specialist. “Additional support for the WSU Plant diagnostic lab is essential to provide sustainable robust public diagnostics so growers can identify and quickly manage the multiple problems that attack their trees.”
Removing infected trees quickly is the best way to fight the disease, as there is no treatment and early removal can limit spread of the virus to nearby trees in an orchard, Harper said. Testing also helps avoid removing a tree exhibiting symptoms that look like the disease, but isn’t infected with little cherry pathogens. —
-

CA Avocado Merchandise Orders Increase By Triple Digits Near Holiday Season
California avocado merchandise, available on Shop.CaliforniaAvocado.com, is a very visible and effective means of driving brand awareness year-round. The online merch shop, which was launched in fall 2020, was updated in fall 2021 with new merchandise designed to pique consumer interest prior to the holiday shopping season. The new California avocado merchandise included a “Best Friends Sweatshirt” perfect for cozy moments, the “Avo Head” hat suited for athletic and outdoor events and the “Tasteful Apron” that can be worn for any avo-casion. To drive consumer awareness of the new items, which primarily showcased the 2021 take on “the best avocados have California in them” campaign, the California Avocado Commission launched integrated social media and digital promotions leading to a 500+% increase in November and December orders as compared to the preceding two months.

Interacting with consumers on social media requires a delicate balance — providing fresh content and merchandise promotions that engage your audience without causing burnout or oversaturation that leads them to tune out. The Commission crafted social media posts showcasing people wearing the newly released California avocado merchandise while engaging in a variety of activities that evoke the California lifestyle. These everyday-lifestyle posts, which are some of CAC’s most successful social media content in terms of engagement and driving traffic to the site, complemented those created by CAC’s influencer partners. In the off-season, the posts also were tied to cultural moments — like Black Friday or Cyber Monday — to drive increased buzz and engagement for the holidays. In addition, the Commission also used paid support for select social media posts on Instagram and Facebook to boost views and engagement beyond CAC’s main followers during key shopping moments. To make it easy for consumers to purchase the items, many of the social media posts included direct links to the merch shop item featured in the post. The social content shared in November and December to support the launch of new merch reached nearly 339,000 consumers and yielded nearly 5,100 engagements, including nearly 4,000 link clicks to merchandise items.
The CaliforniaAvocado.com website is popular with people looking for California avocado recipes and serving tips and tricks. Therefore, to catch the eye of site visitors the Commission featured some of the new merchandise on the landing page’s header. During the holiday shopping season, the “Free Shipping on Orders over $60” messaging was extended through December 31.
In the near future, the Commission will feature these merchandise items in specialized collections inspired by different regions of the state, drawing even greater attention to and a connection with California avocados and the West Coast lifestyle embodied throughout the state. — By the California Avocado Commission
-
California’s Vegetable Value Down 15% from 2020
The value of California’s 2021 utilized vegetable production dropped 15% to $7.24 billion compared to 2020’s value of $8.55 billion according to the USDA National Agricultural Statistics Service, Pacific Regional Field Office.
Despite the decrease in state’s overall total value of utilized production, crops showing an increase included asparagus, snap beans, cabbage, celery, cucumbers, garlic, honeydews, onions, chile peppers, pumpkins and tomatoes.
California fresh market and processing vegetable growers harvested 920,800 acres of principal vegetable crops in 2021, up 1% from 2020. Utilized production totaled 404 million hundred weight down 6% from 2020’s 428 million hundred weight.
California leads the nation in vegetable production, accounting for over 40% of the U.S. vegetable acreage.
USDA NASS recently posted the Vegetables 2021 Summary for vegetables grown during the 2021 crop year in California and across the U.S. The report includes survey data collected for acreage, production, marketing year price and value collected on an annual basis for 26 vegetable and melon crops in the U.S. Questionnaire content, survey timetables, and survey administration are state specific. Data are gathered by telephone interviews, mail, faxed, and online reporting.
For a copy of the full report, visit Vegetables 2021 Summary. Below are comments for crops where The Golden State is the largest producer.
Artichokes: Total California production in 2021 totaled 833 thousand cwt, up 9% from 2020. Planted area was estimated at 4,900 acres, down 4% from the previous year. Area harvested, at 4,900 acres, was down 4% from 2020. The value of the crop totaled $57.5 million, 10% below the previous season. Utilized production totaled 833 thousand cwt, all of which was for the fresh market.
Despite artichokes in the Coachella region getting off to a late start due to the desert heat, the plants flourished and were very productive. In the primary growing region of the Central Coast, cool winter weather and pest pressures reduced early supplies, but better spring weather allowed the crop to recover with good quality and excellent production.
Broccoli: Total California production in 2021 totaled 12.3 million cwt, down 14% from 2020. Planted area was estimated at 95,000 acres, up 6% from the previous year. Area harvested, at 94,500 acres, was also up 6% from 2020. The value of the crop totaled $631 million, 19% less than the previous year. Utilized production totaled 12.3 million cwt, of which 11.8 million cwt was for the fresh market and 22.7 thousand tons for processing.
Broccoli prices increased as cooler weather in growing areas limited supplies. Crown quality was very good. Brown bead, hollow core, and yellowing were reported to be minor issues.
Cabbage: Total California production in 2021 totaled 5.40 million cwt, down 8% from 2020. Planted area was estimated at 14,800 acres, down 2 % from the previous year. Area harvested, at 14,600 acres, was up 2% from 2020. The value of the crop totaled $155 million, 5% more than the previous season. Utilized production totaled 5.40 million cwt.
Weather during planting in the fall of 2020 and through head development in 2021 was favorable. No significant pathogen impact on the crop was reported. Demand for cabbage was on the rise with consumer interest in health benefits during the continuing pandemic. Weather conditions were a mixture of dry and wet conditions during the season in most of the cabbage producing areas.
Cantaloupes: Total California production in 2021 totaled 6.90 million cwt, down 4% from 2020. Planted areas was estimated at 23,500 acres, up 7% from the previous year. Area harvested, at 23,400 acres, up 7% from 2020. The value of the crop total was $163 million, a decrease of 11% from previous year. The utilized production was 6.90 million cwt, all of which was for the fresh market.
Production of cantaloupes was strongly impacted by higher input costs, including water.
Carrots: Total California production in 2021 totaled 25.2 million cwt, up 2% from 2020. Planted area was estimated at 61,700 acres, an increase of 2% from the previous year. Area harvested, at 61,400 acres, is also up 2% from 2020. The value of the crop totaled $654 million, 5% less than the previous year. Utilized production totaled 25.1 million cwt.
The rise in the pandemic led to a surge in carrot demand, resulting in an increase in prices and labor costs. The market was steady with good supplies; growers saw jumbo and cello size in the fields. In the southern San Joaquin and Cuyama Valleys, the top carrot producing counties in California, growers reported severe drought conditions, limiting water supplies in 2021.
Cauliflower: Total California production in 2021 totaled 7.07 million cwt, down 11% from the previous year. Planted area was estimated at 39,400 acres, up 6% from 2020. Area harvested, at 39,300 acres, was up 7% from the previous year. The value of the crop totaled $266 million, 2% less than the previous season. Utilized production also totaled 7.07 million cwt.
Prices received by growers improved. Cooler weather slowed growth, resulting in lighter volume, but quality remained strong with good sizing and color
Celery: Total California production in 2021 totaled 15.3 million cwt, a decrease of 5% from 2020. Planted area was estimated at 28,000 acres, down 4% from the previous year. Area harvested, at 27,800 acres, showed a decrease of 3% from the previous year. The value of the crop totaled $375 million, up 5% from previous year. Utilized production for 2021 totaled 15.3 million cwt, down 5% from 2020.
Cold and wet weather slowed production during the end of the year. Some growers in the Oxnard area reported crop damage due to flooding and a canal breach. Additionally, fusarium and insects caused reduced yields for some producers. The market was tight for organic celery during a portion of the 2021 growing season.
Garlic: Total California production in 2021 totaled 4.19 million cwt, an increase of 18% from 2020. Planted area was estimated at 26,500 acres, up 12% from the previous year. Area harvested, at 26,200 acres, also showed an increase of 11% from 2020. The value of the crop totaled $244 million, up slightly from the 2020 value of $242 million. Utilized production also totaled 4.19 million cwt.
Despite the minimal water availability and the extreme heat, the garlic crop was above average. Moisture received in April was beneficial and the crop was able to survive the hot temperatures
Honeydew: Total California production in 2021 totaled 1.76 million cwt, down 20% from 2020. Planted area and harvested area were both estimated at 6,900 acres, down 4% from the previous year. The value of the crop totaled $48.9 million, up 7% from the previous season. All production was sold for the fresh market.
Higher input costs, including water, reduced supply of honeydew melons. Consumer demand increased, which resulted in higher prices than the previous season.
Head lettuce: Total California production in 2021 totaled 24.9 million cwt, down 11% from 2020. Planted area was estimated at 76,000 acres, up 3% from the previous year. Area harvested, at 75,400 acres, was also up 3% from 2020. The value of the crop totaled $728 million, 19% less than the previous season. All utilized production was sold for the fresh market.
The head lettuce market was steady while supply remained low. Labor, weather, and quality were concerns throughout the growing season. High temperatures and humidity in the Salinas Valley during July and August caused stress for some of the crop, which resulted in internal burn and fog burn. There were also reports of below freezing temperatures causing harvesting and packing delays.
Leaf lettuce: Total California production in 2021 totaled 10.2 million cwt, down 23% from 2020. Planted area was estimated at 50,000 acres, down 6% from the previous year. Area harvested, at 49,700 acres, was 4% lower than 2020. The value of the crop totaled $532 million, 44% less than the previous season. Utilized production was all sold for the fresh market.
Production of leaf lettuce continued to trend downward as the market remained steady. Quality was fair, while pricing remained competitive. Extreme temperatures affected crop quality and harvest efforts. There were reports of below freezing temperatures, causing harvesting and packing delays.
Romaine lettuce: Total California production in 2021 totaled 20.1 million cwt, down 12% from the 2020 total. Planted area was estimated at 71,300 acres, up 3% from the previous year. Area harvested, at 70,400 acres, was up 4% from 2020. The value of the crop totaled $768 million, 37% less than the previous season. All production was sold for the fresh market.
The Romaine lettuce crop experienced some quality issues that affected yields and resulted in substantial price decreases compared to 2020.
Onions: Total California production in 2021 totaled 19.0 million cwt, down slightly from 2020. Planted area was estimated at 45,800 acres, up 7% from the previous year. Area harvested, at 45,300 acres, was up 6% from 2020. The value of the crop totaled $297 million, 10% more than the previous year. Of the utilized production, 9.51 million cwt was sold for the fresh market and 475 thousand tons were for processing.
Growers had low expectations early in the season, given the extreme heat challenges and limited water supply. Onions dried up too quickly and volumes were disappointing. Dryness and long periods of intense heat, led to expansion of wildfires and prolonged lack of sunlight, causing minimal damage to the crop. Widespread, Fusarium basal rot was reported on the west side of the San Joaquin Valley, causing some onions to decay and lower yields.
Bell peppers: Total California production in 2021 totaled 3.83 million cwt, down 24% from 2020. Planted area was estimated at 9,200 acres, down 22% from the previous year. Area harvested, at 9,000 acres, was down 23% from 2020. The value of the crop totaled $185 million, 31% less than the previous year. Utilized production totaled 3.82 million cwt, of which 2.17 million cwt was for the fresh market and 82.2 thousand tons was for processing.
Bell pepper growers were faced with rising production costs and transportation issues.
Spinach: Total California production in 2021 totaled 5.17 million cwt, up 2% from 2020. Planted area was estimated at 40,300 acres, down 5% from the previous year. Area harvested, at 39,800 acres, was also down 5% from 2020. The value of the crop totaled $359 million, 11% less than the previous season.
Water supply was an issue for spinach growers as they experienced severe drought conditions during the 2021 growing season.
Tomatoes: Total California production in 2021 totaled 224 million cwt, down 4% from 2020. Planted area was estimated at 251,000 acres, down 2% from the previous year. Area harvested, estimated at 248,900 acres, was unchanged from the previous year. The value of the crop totaled $1.18 billion, 6% higher than 2020. Utilized production totaled 222 million cwt, of which 6.72 million cwt was for the fresh market and 10.8 million tons were for processing.
Drought concerns impacted planting decisions for the 2021 processing tomato crop and planted acreage decreased significantly from early season contracted intentions. Extremely high temperatures in May and throughout the summer lowered expected yields and slowed down operations at the canneries. Harvest began the first week of July and continued through November, marking the longest harvest in recent years.
For more agricultural statistics, visit www.nass.usda.gov.
-

California Olive Oil Grower Meeting, March 3
Please join the Olive Oil Commission of California (OOCC) for California Olive Oil Day on March 3, 2022, at the Robert Cabral Agriculture Center in Stockton. During this meeting, industry experts and researchers will present information on the latest innovation and research critical to the production of top-quality extra virgin olive oil.
The meeting will begin at 9 a.m. with a welcome from OOCC Executive Director, Chris Zanobini and Research Committee Chairman, Michael Fox.
New research will be presented on several topics pertaining to olive orchard and disease management and best growing practices. These topics will include: water management strategies for hedgerow olive orchards in California: evaluation of canopy management practices on established Super High-Density olives for olive oil production: investigating young tree decline as a result of autumn frost events; epidemiology and management of olive knot; and evaluation of new fungicides in the control of olive leaf spot/peacock spot.
The research in this session will be presented by Giulia Marino, Dept of Plant Science, University of California, Davis; Ciriaco Chavez, Boundary Bend; Mohammed Nouri, UC Cooperative Extension Orchard Systems Advisor, San Joaquin County; and James Adaskaveg, Professor, Dept of Plant Pathology, UC Riverside.
Javier A Fernandez Salvador, Executive Director of the UC Davis Olive Center will then provide an update on the Center’s activities and Selina Wang will present findings of the Olive Center’s analysis of 2020 olive oil quality data collected as part of the OOCC’s mandatory sampling and testing program. Wang will also present findings from the Olive Center’s evaluation of fatty acid and sterol profiles.
Wang will then provide reports on the UC Ag and Natural Resources Production Manual for Olive Oil and the latest findings from a study on utilizing olive pomace to make pavement. These presentations will be followed by an update on the establishment of benchmark data for the olive oil industry in California from Kyle J. Birchard of Integrative Economics, LLC.
Attendees can also expect to hear updates from Kimberly Holding, CEO of the American Olive Oil Producers Association (AOOPA), and Shanna Rahman, Board Chair of the California Olive Oil Council (COOC).
The day will conclude at 12:30 p.m. with lunch provided by the OOCC. To RSVP, please email anne@agamsi.com.