Category: Non-Video

  • How to Improve Soil Health in Potato Cropping Systems

    Minimizing soil disturbance is one of the key tenets promoted to build soil health in agricultural systems. Many farmers across the county have adopted reduced and no-till systems to build soil carbon, a central component to healthy soils. But what if you grow a crop where the part you sell is underground – like potatoes? What are some options to build soil health in those systems?

    In the US, overall, the potato industry was a $4 billion industry in 2020. Americans will eat their potatoes fresh, frozen, fried, chipped, canned, dehydrated. Potato products are also used as food ingredients, like potato starch.

    Potatoes are a valuable crop in Washington state. We are the second leading producer of potatoes in the United States (after neighboring Idaho.) Central Washington grows Russet potatoes primarily for French fries and other processed potato products. Northwestern Washington is known for colorful, fresh-market potatoes.

    The potato industry in Washington recognizes the importance of healthy soils for long-term, sustainable production of the crop. One issue with growing potatoes: they are a tuber crop, growing belowground. Thus, planting and harvesting them disturbs the soil more than a crop like wheat or barley, which are harvested aboveground. Growers and researchers are working on strategies to promote soil health in this typically high disturbance system.

    Through Washington’s new Soil Health Initiative, my team and collaborators recently set up a long-term rotational experiment to explore some of these strategies in potato-based systems. The strategies represent the typical rotations and soils of the area. The trial is designed with methods that use changing levels of:

    • soil disturbance (i.e., tillage),
    • organic matter inputs,
    • internal (cover crops and residues) and,
    • external (compost).

    This allows us to study multiple soil health principles and how they interact with one another.

    Potatoes in northwestern Washington are typically grown in a particular field every 3-5 years. Soil improvement strategies are really focused on what happens before and after the potato crop.

    One practice many growers are experimenting with is cover cropping. Cover crops are grown between cash crops to provide agroecosystem benefits related to 3 of the 4 main soil health principles: cover the soil, increase diversity, and maximize continuous living roots, which help feed microorganisms in the soil.

    Farmers in the area are using two methods. One is winter cover crops, planted in fall and terminated in spring. The other is multi-year cover crops that are mowed and continuously provide organic carbon inputs to the soil.

    Our cold, wet fall and spring seasons can be a challenge to establishing winter cover crops. This is due to harvesting potatoes through October. But having cover crops between all other rotational crops may still benefit the soil.

    The multi-year cover crop likely provides more soil benefits, but farmers are then missing out on several years of growing a cash crop. Our experiment looks at both cover crop strategies and their effects on soil properties, crop yields, ecosystem benefits, and farm economics.

    We are also studying potato-growing systems that reduce soil disturbance. We’re looking at whether it’s both feasible and beneficial to rotate in wheat or barley planted with no-till seeders. Minimizing soil disturbance between potato crops could improve soil health and future potato yields.

    Ultimately, we need to take a systems approach to improving soil health with potatoes and with any crop. It is not just about one crop. It’s about how the whole cropping system is managed over time. By finding those intervention points to introduce a soil-building practice, we can steadily improve soil health even with underground crops. — By Deirdre Griffin-LaHue, Washington State University
  • California Prunes Partners with Renowned Chefs for CA Farmer and Farmworker Month

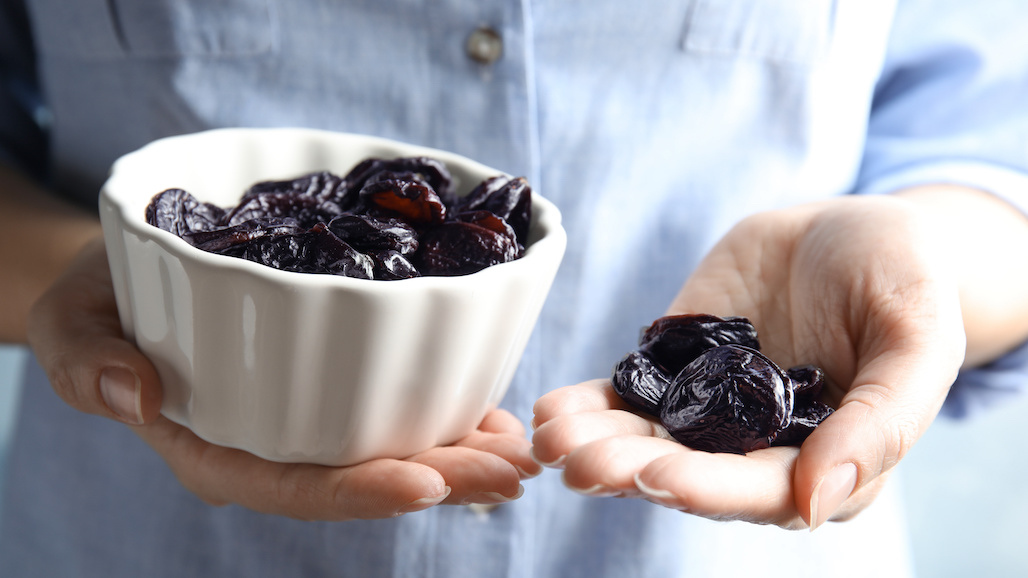
    California Prunes Partners with Renowned Chefs for CA Farmer and Farmworker Month

    October is California Farmer and Farmworker Month – a specially designated time to recognize the remarkable contributions of the people who power California’s food and farming community. Consider this: California supports 1.2 million agriculture-related jobs and produces 400 different crops, roughly 50 percent of the overall U.S. produce supply, and nearly all domestically grown prunes.

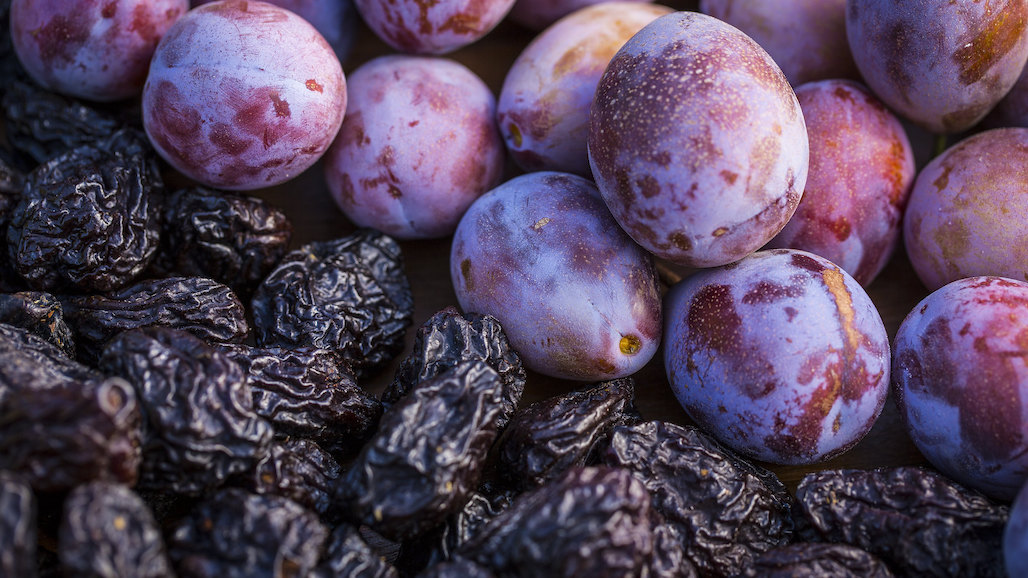
    To help celebrate the hardworking farmers and farmworkers of the Golden State, California Prunes is partnering with a line-up of accomplished chefs around the United States to showcase the delicious, dried fruit that is grown by about 600 California Prune growers in the Sacramento and San Joaquin valleys. The chef partners are featuring a range of California Prunes dishes that consumers across the country can enjoy, including:

    • Aliza Sokolow of This is What I Eat is an accomplished food stylist and author based in
      Los Angeles, Calif. Sokolow regularly bakes for charitable organizations and for the first part of October she will offer Chocolate Chunk Cookies with Prunes that can be enjoyed when ordered directly through the This is What I Baked Order Form (proceeds donated to California Farmworker Foundation).
    • Bronwen Wyatt of Bayou Saint Cake in New Orleans, La., offers a Chocolate Walnut Chiffon Cake with Prunes and Chicory Cream available for New Orleans residents throughout October. Local ingredients are a mainstay of her Instagram-famed cakes. California Prunes are not only local for those in New Orleans since California supplies the country’s prunes, but the premium fruit also adds depth of flavor to the other California-grown ingredients, like California Walnuts. Additional California Prunes recipes from Wyatt include a Prune Upside Down Cake and Almond Cake with Prune-Raspberry Butter.
    • Kat Turner of Highly Likely Cafe in Los Angeles, Calif. has come to love California Prunes in several recipes and currently features A Good Turkey Sando with Prune Mostarda on the menu at the
      Los Angeles eatery. The Prune Mostarda recipe is an incredibly versatile condiment that anyone can make at home and use for sandwiches, grazing boards, or to elevate a variety of proteins.
    • Mica Talmor of Pomella restaurant in Oakland, Calif. will feature California Prunes that have come from orchards in the surrounding area in her Chicken + Prune Tagine menu item all month long.

    “As a chef, coming from Wisconsin to California – with its surreal year-round growing season – it’s like winning Willy Wonka’s Golden Ticket,” said Chef Kat Turner, Highly Likely Cafe. “And, thanks to the tireless efforts of farmers and farmworkers, we have wave after wave of delicious, healthy, gorgeous food grown right here in the state, including those sensual, premium quality prunes whose flavor can truly transform a dish with their uniquely craveable taste, texture, and versatility.”

    In addition to featuring California Prunes on their menus, the chefs will also serve up tasty California-grown ideas and inspiration on their respective social media platforms throughout the month.

    California is the ideal place to grow prunes due to its alluvial soils, abundant sunshine, and the fresh water that runs off the nearby mountains. The multi-generational farming families who grow California Prunes have honed their craft for more than 100 years and are dedicated to cultivating their orchards with sustainability in mind for the next generation.

    “We honor the contributions of growers who work so hard to ensure we have delicious, healthy food every day,” said Kiaran Locy, California Prune Board, Director of Brand & Industry Communications and Buy California Marketing Agreement board member. “It’s inspiring to partner with chefs who use locally and responsibly sourced ingredients and appreciate the versatility of California Prunes because they runes are good every day in so many ways – from delivering exceptional nutrition that supports a healthy gut and bones – to adding big flavor and natural sweetness.”

    Always in season, California Prunes ideas and inspiration can be found anytime @CAPrunes onInstagram, Facebook, Pinterest, YouTube, Twitter and at www.californiaprunes.org.

    ABOUT THE CALIFORNIA PRUNE BOARD

    Created in 1952, The California Prune Board aims to amplify the premium positioning and top-of-mind awareness of California Prunes through advertising, public relations, promotion, nutrition research, crop management and sustainability research, and issues management. The California Prune Board represents approximately 800 prune growers and 28 prune, juice, and ingredient handlers under the authority of the California Secretary of Food and Agriculture.

  • Produce Veteran Jeff Oberman To Lead California Avocado Commission

    Produce Veteran Jeff Oberman To Lead California Avocado Commission

    The California Avocado Commission Board of Directors has selected produce veteran Jeff Oberman to become the organization’s new president, effective October 10, 2022. Mr. Oberman’s produce industry career has spanned 25 years so far. From 2020 to the present he served as vice president of sales – business development for PRO*ACT and was their vice president strategic programs for the prior two years. From 1997 to 2018 Mr. Oberman worked for the produce trade association United Fresh in successively more responsible roles. For more than half his tenure at United Fresh he served as vice president, trade relations.

    “We are very pleased that Jeff Oberman has accepted the position of California Avocado Commission president,” said Rob Grether, chair of the Commission Board of Directors. “Jeff’s broad network, non-profit association leadership and fresh produce business experience, including an end-to-end understanding of the needs of growers, handlers, distributors, foodservice operators and retail customers makes him exceptionally well-suited to lead the California Avocado Commission.”

    Mr. Oberman has extensive experience in trade association leadership, strategic planning, and management of customer and government agency relations. He has received numerous accolades and awards including being named to Produce Business Magazines “40 under Forty” list in 2005 and to The Packer’s “25 Profiles in Leadership” in 2017.

    “Having the opportunity to take the helm and build on the California Avocado Commission’s well-deserved reputation for innovative marketing and grower advocacy is exciting, said Oberman. “Like most agricultural producers, California avocado growers face a host of ever-changing challenges, and I look forward to steering the Commission in support of long-term grower success.”

  • Avocado Growers Encouraged To Complete Crop Damage Form

    Avocado Growers Encouraged To Complete Crop Damage Form

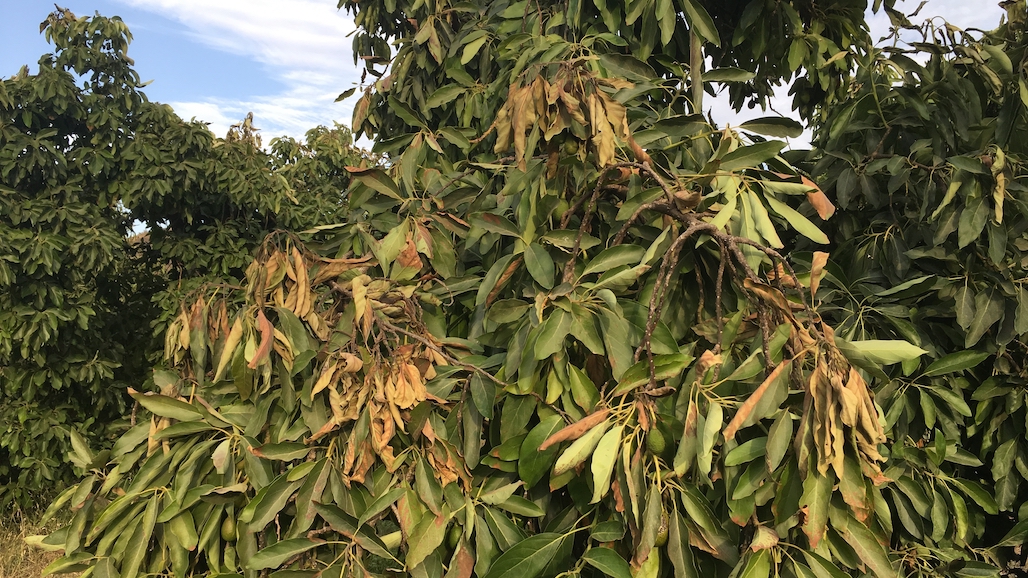
    California avocado growers in San Diego County are encouraged to complete the Frost/Heat Damage Assessment Form to report crop damage experienced by the recent extreme temperature events. The Department of Agriculture, Weights and Measures is gathering data via this form that will help the county determine estimated damage assessment costs for emergency assistance. The form can be emailed to sdcawm@sdcounty.ca.gov. For assistance, contact 858.694.2739.

    Growers who have experienced crop damage also can reach out to the U.S. Department of Agriculture’s Farm Services Agency for potential resources and support. FSA can be reached at 760.347.3675. The FSA loan department contact, Sherrie Hodges, can be reached at 661.281.2755. For additional resources, visit the Crop Disaster Assistance and Tree Assistance Program webpages.

  • New Prune Varieties Show Promise in Reducing Fruit Drying Costs

    New Prune Varieties Show Promise in Reducing Fruit Drying Costs

    2022 is a year of ugly jerks in input costs. Fuel and fertilizer prices are way up. Higher natural gas and labor costs are pushing up drying costs, further reducing net grower returns in what looked to be a good market year. Mechanical pruning and careful production practices (to name a few steps) may help cut costs in the short term in established orchards. In the long run, cutting drying costs and increasing harvest timing flexibility may help prune growers net returns and stay in business. This long-term picture will require developing and field-testing new prune varieties that market like ‘French’ prune but have much lower dry away ratios (2-2.5) and hang longer on the tree without harming dried fruit quality.

    The UC Davis Prune Variety Development program, funded by the CA Prune Board, has developed several French-type prune varieties with low dry away numbers (2-2.5). These varieties “dry on the tree” while retaining good fruit quality. Projected savings for grower could be hundreds of dollars per acre in drying costs (see projected costs in the table below). These new varieties can be harvested over a longer time period giving growers more flexibility in managing harvest. More information on new varieties and contact information for UCD Prune Devo program are available on-line.

     Four new, numbered varieties performed well in small trials over several years. These varieties must be field-tested in small plantings (1-2 acres) before a large orchard should be planted. Test trees are available to interested growers. For more information on availability of test trees, contact Sarah Castro (scastro@ucdavis.edu) with UC Davis Prune Variety Devolopment program. 

    Projected differences in hauling and drying costs for ‘French’ prune (thinned or unthinned) and a new, unreleased ‘French’-type prune variety (J2N-128). These figures are intended as an example of possible production values.

    **This variety selected only as an example. There are four ‘French’ type varieties that show promise.  By Franz Niederholzer, UCCE Farm Advisor, Colusa and Sutter/Yuba Counites

  • Opportunities to Export Fresh Fruit to Germany

    Opportunities to Export Fresh Fruit to Germany

    Germany is one of the largest markets for fruit in Europe. The relative affluence of its population of 83 million people makes it an attractive outlet for exporters from many countries. This product brief highlights certain aspects of the German fresh fruit market and provides marketing, trade, and regulatory information for U.S. exporters.

    Germany, with a population of 83.2 million (18 percent of the EU-27 total population), has the largest economy in Europe and is a leading European market for food and beverages. In 2021, food retail sales in Germany totaled 231.5 billion Euro (approx. USD $274 billion). In 2018 (latest available data), German households spent 28.45 Euro (approx. USD $33.57) per month on fruit.

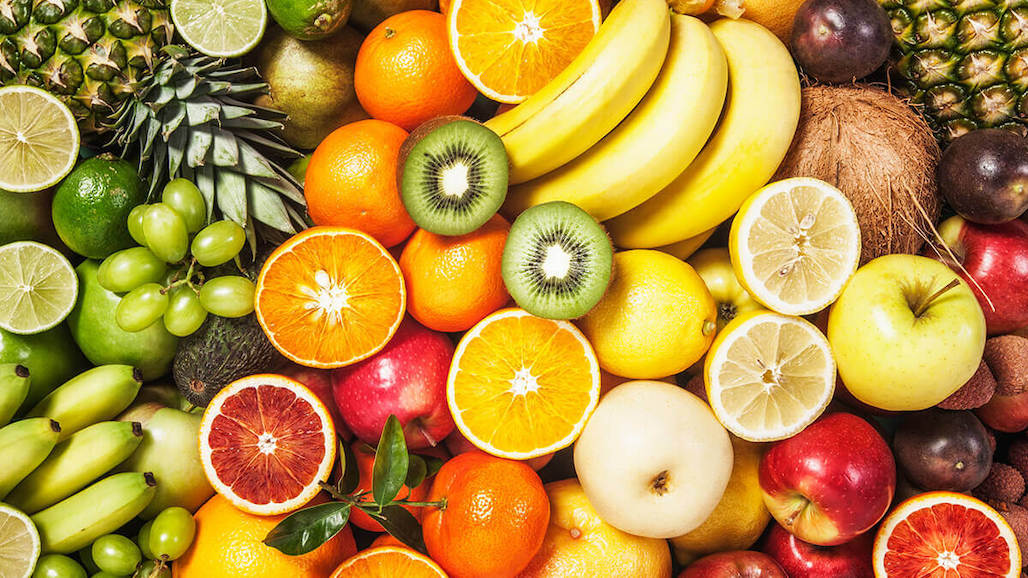
    In calendar year 2021, Germany was the 7th largest producer of fresh fruit in the EU-27 and the largest fruit consumer. In MY 2020/21, Germans consumed approximately 8.8 million MT of fruit, including frozen and canned fruit on a fresh weight basis. Germans show a preference for fresh fruit, but in MY2020/21 also consumed 67,529 MT of frozen fruit and 125,000 MT of dried fruit. In addition, Germans consume more fruit juices and nectars per capita than any other European country and the United States. The top five fruits consumed in Germany are apples, bananas, oranges, grapes, and clementines. However, Germans are also quite familiar with exotic fruits such as mangos, passion fruit, avocados, and lychees.

    Germany’s position as the largest EU-27 consumer of fruit results from the size of its population rather than high per capita consumption. Growing health consciousness and factors within the German socio- economic makeup, in particular its aging and increasingly foreign-born population, could favor an increase in per capita fruit consumption. At the end of 2021, 22 percent of the population was 65 years and older while only 13 percent were younger than 15 years of age. Moreover, Germany has a high number of immigrants from Turkey and other Mediterranean countries whose diets include a higher percentage of fruits than the traditional German diet. Immigrants in Germany also tend to spend a higher percentage of their income on food. At the end of 2021, more than 11.8 million citizens of other countries lived in Germany. Additionally, in 2020, 4.9 million German residents had a migrant background (i.e., either they or their parents were born with a citizenship other than German and acquired German citizenship later in life). Read the full report from the USDA Foreign Ag Service HERE.

  • World Avocado Congress Set For April 2-5 In New Zealand

    World Avocado Congress Set For April 2-5 In New Zealand

    The 10th World Avocado Congress will take place April 2 – 5, 2023 in Auckland, New Zealand. The event will bring together industry members from across the globe and include field day sessions, as well as in-person academic sessions. Those sessions will cover the following topics:

    • Sustainability
    • Production and productivity
    • Breeding and genomics
    • Pests and diseases
    • Grower education programs
    • Processing
    • Food safety
    • Agritech
    • Post-harvest supply chain
    • Nutrition in human health
    • Country reports
    • Consumers

    list of speakers is available on the World Avocado Congress website. The scientific and marketing committees are seeking abstracts from researchers and innovators. The deadline to submit abstracts for oral or poster presentations is October 10, 2022.

    Online registration for the event is now available. For those who wish to exhibit at the Congress, the online exhibition portal is now open.

  • Irrigation Stress and Early-Navel Orange Fruit Maturity

    Irrigation Stress and Early-Navel Orange Fruit Maturity

    To maximize profits in the early navel orange market, growers need to have large fruit size and sufficient yellow-orange color and a high enough sugar-acid ratio to meet or exceed the legal minimum harvesting standards. Growers of early-maturing navel oranges in Kern County use different strategies to produce these oranges. Some growers irrigate at full evapotranspiration rates nearly up to harvest with the belief this will maximize fruit size, while others begin deficit irrigating a month or two prior to harvest to maximize development of sugar and color to promote earlier maturity. Little information exists in the literature to assist growers in making decisions related to producing early maturing navels such as Beck, Fukumoto and Thompson Improved. To determine the effects of late season irrigation stress, I, along with two University of California co-researchers Blake Sanden and Dr. Mary Lu Arpaia, participated in an experiment to elucidate some of the trade-offs that relate to irrigation strategies and early navel fruit production. The research was conducted from 2006 through 2008 in a cooperating grower’s Beck orchard at the extreme southern end of the San Joaquin Valley. Our generous and patient cooperating growers were George and Colby Fry.

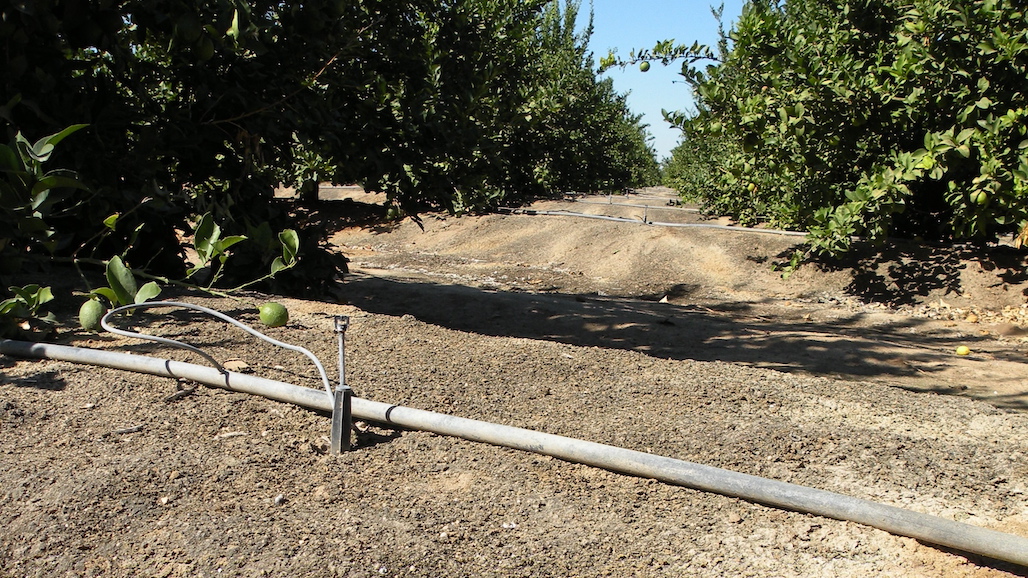
    Three different irrigation treatments, defined as low, mid and high, were developed based on the relative amounts of irrigation water applied to the test plots. Each plot consisted of 10 trees in a central row, bordered by ten similarly irrigated trees in the two adjacent rows. Each treatment was replicated five times. The same irrigation treatment was applied to the same plots for the first two years, while in the third year the low treatment was changed to the high treatment to provide information on how rapidly the trees would recover from stress. The different irrigation treatments were administered by using irrigation emitters with different flow rates and by differentially shutting off water to some treatments as needed to achieve desired stress levels. Between growing seasons, the top three feet of soil profile was refilled with water during the winter and differential irrigation began in early August. Measurable differences in tree shaded stem water potential among treatment usually were noted by early September. In the second year of the experiment (2007), the low and mid-irrigation treatments applied approximately 38 and 71 percent, respectively on average, of the water of the high treatment. Water potential measurements made mid-day on shaded, interior leaves demonstrated that good separation was achieved among the three differential treatments. In 2007, for example, shaded stem water potential measurement in early September were about -9, -12, and -18 bars for the high, mid and low irrigation treatments, respectively and at harvest in mid-October were -12, -18, -24, respectively. Neutron probe measurements also demonstrated that trees differentially depleted available water stored in the soil as the season progressed (data not shown). In 2007, differences in applied water among the treatments were large. Including the increased quantity of water applied to refill the soil profile in the winter, 3.55, 2.58 and 2.11 acre feet of water on a per acre basis, were applied to the high, mid and low irrigation treatments respectively, from October 30, 2006, to harvest, October 15, 2007. Rainfall was minimal.

    Again, using 2007 as an example, as the level of applied water decreased, soluble solids (i.e. sugars) and titratable acid, were greater at harvest, although the sugar acid ratio was not different (see Table 1).

    Rows in the experimental orchard were oriented east and west. Fruit on the south side of the tree had higher soluble solids concentration and sugar/acid ratio than fruit on the north side of the tree, regardless of irrigation treatment. Fruit juiciness, either measured as weight of juice to weight of fruit (see Table 1) or volume of juice per weight of fruit (results not shown) were not different among irrigation treatments, suggesting the increase in sugars and acid was the result of osmotic adjustment and not fruit dehydration. We were also interested in seeing if the differential irrigation treatments influenced eating quality of the fruit. To test this idea, we provided fruit from the highest and lowest irrigation treatments of 2007 and 2008 to volunteer panelists at the UC Kearney Ag Center and asked if they could detect any differences between the fruit. Results from both years showed that the panelists could not detect differences between the two irrigation treatments. This suggests that the increase in soluble solids in the low irrigation treatment was not sufficient to influence eating quality.

    In 2007, yield and grade decreased as the amount of applied water decreased (see Table 2).

    Fruit in the high and mid irrigation treatments peaked on size 56 per carton and on size 72 per carton in low treatment (data not shown). The decrease in fruit grade at pack-out appeared to be largely due to a more oblong shape. The negative yield, fruit size and grade effects measured in the low and mid treatments in 2007 were probably the cumulative result of deficit irrigation in Years 1 and 2 and not just Year 2 alone. Reduced rates of irrigation hastened development of fruit color compared to the high irrigation treatment (see Table 3) and this occurred every year.

    The deleterious effects on yield, and grade on the trees in the low-irrigation treatments suggested that not much would be gained by continuing this level of stress for a third season in the same plots. In 2008, the low irrigation treatment was replaced by a high irrigation treatment and, at harvest, yield by weight and fruit numbers were not different from the control high-irrigation treatment. This observation demonstrated that the Beck navels rebounded quickly from the low irrigation stress of 2006 and 2007. The mid-level irrigation stress of 2006 and 2008 was less severe than that of 2007, and yield and fruit quality was not as adversely affected as in 2007.

    This study provides information on some of the trade-offs that might be expected among fruit yield, size, grade, sugar and color in relation to reduced irrigation as harvest approaches. More detailed information from the trial can be found at the following link: https://doi.org/10.21273/HORTSCI.46.8.1163. How growers respond to this information will depend on their approach to profiting in the early navel market and how much water will be available for irrigation. If reducing water use is the primary goal of the grower, while minimizing effects on yield and fruit quality compared to fully irrigated orchards, work by Dr. Goldhamer, UC irrigation specialist, demonstrated that regulated deficit irrigation in the mid-May through mid-July time period would be the best strategy. The authors gratefully acknowledge the Citrus Research Board for its financial support of this project. — By Craig Kallsen, UC Cooperative Extension Farm Advisor, Subtropical Horticulture & Pistachio, Kern County

  • Grower-Shippers Asked to Bear Burden of Unsustainable Dilemma of Under-Compensation

    Grower-Shippers Asked to Bear Burden of Unsustainable Dilemma of Under-Compensation

    In the past two years, West Coast vegetables growers have been asked to absorb stratospheric aggregate inflationary input costs while at the same time trying to find a way to pass on 20%-30% inflationary costs, presenting them with an unsustainable dilemma. Without a long-term solution to this dilemma, we could all see fewer vegetables finding their way to grocers’ shelves.

    The recently published Bureau of Labor statistics Consumer Price Index (CPI) for August reported food prices increased 11.4% from 2020 to 2021, continuing a now-prolonged trend of the largest 12-month increase since May of 1979. The statistics also highlighted a 1.1% increase over June 2022 and was the seventh consecutive monthly increase of 0.9% or more.

    Moreover, since January 2022, the price of food consumed at home outpaced that of food consumed away from home, up 13.1% in July 2022 versus July 2021. In reviewing of the CPI-U data from the past 16 months when inflation began to rise to their current 40-year high, the CPI “Food” category has either been in alignment with or slightly higher than the “overall” monthly CPI category. And, as anyone who has purchased food staples such a poultry or beef or eggs can attest, they’re record prices over the past 18-plus months. In fact, the CPI’s food-at-home category continues to steadily increase, driving the CPI’s overall increases in the food category.

    As if circumstances in inability of cost pass-through was challenging enough, the growers in the “Salad Bowl of the World” have endured below break-even pricing on many commodities for the past two-plus years. Iceberg lettuce’s open market FOB pricing is a prime example. Against the backdrop of 20% to 30% production cost increases, the iceberg markets over the same timeline have been a losing enterprise.

    In reviewing the USDA agriculture marketing service dating back to calendar year 2020, open market carton iceberg lettuce pricing only experienced six months of pricing reflecting above break-even levels. The data for 2021 reflected far worse market pricing conditions as only three months out of the calendar year showed profitability in iceberg lettuce pricing.

    The 2022 iceberg lettuce open market conditions to-date are reflecting only three of the eight expired months at profitable levels, although it is widely accepted that over 60% of day-to-day iceberg lettuce is sold via contract pricing. However, the commodity portion of daily production represents a significant investment for both growers and shippers.

    Providing further context on how poor commodity lettuce open-pricing conditions have been the past two years in relation to the Bureau’s CPI, from January through June of this year, the monthly year-over-year lettuce CPI category reflected increases ranging from a low of 7.9% to a high of 12.7%. Five of the six months reported accounting for an aggregated approximately per-case price of $3.60, “below break-even!” Keep in mind that many commodity iceberg deals are structured where both grower and shipper have joint equity.

    However, there are some positive developments that should benefit growers. Earlier this summer, the shipper/processor community successfully renegotiated favorable finished-goods price increases in contracts with many big box retailers. Within all finished-goods pricing resides the cost of raw materials used in the production of the finished offering. This being the case, the year-over incremental input costs which have not been met, theoretically have been accounted for and the input cost pass-through negotiations should reflect the finished-goods contract price increases. Stay posted.

    On the surface, it might seems that these types of CPI increases would be a boon for growers. However, from the West Coast vegetable grower’s perspective, this data represents a disconnect from the reality of profitability. In analyzing the CPI data, the relevance of what the statistics bares is proof of what this blog has been highlighting for months.

    Beginning in January 2020 and continuing through today, the aggregate inflationary input costs which West Coast vegetables growers continue to primarily absorb has been in the stratospheric range of 20 to 30%. This data reinforces the unsustainable dilemma of under-compensation making its way “back to the ranch.” And, until there is a long-term solution that enables growers’ margins that will enable them to be sustainable, the likelihood grocery shelves stocked with fewer vegetables can be a reality. — By United Vegetable Growers Cooperative

  • 2021 Pacific Northwest Potato Production & Sales Announced

    Growers were happy to see potato prices rise overall in the Pacific Northwest last year. The final value of Idaho’s 2021 potato crop sold was $1.04 billion, up 14 percent from 2020. The marketing year average price for potatoes in Idaho was $8.46 per cwt, up $1.18 from last year. In Oregon, the 2021 potato crop sold was valued at $218 million, up 10 percent from last year. The potato price was $9.02 per cwt, up $1.02 from last year. Washington’s 2021 potato crop sold was valued at $666 million, down 5 percent from 2020. The marketing year average price for fall potatoes was $7.75 per cwt, up $0.19 from the previous year.

    In Idaho, potato production for 2021 totaled 132 million cwt, down 2 percent from 2020. In Oregon, production was 26.3 million cwt., down 3 percent from 2020. Production in Washington was 91.9 million cwt., down 8 percent from 2020. The combined production for the 3 states was 61 percent of U.S. potato production in 2021.

    Processors in Idaho and Malheur County Oregon used a total of 83,070 thousand cwt in 2021, down 8 percent from 2020. Washington and Oregon, excluding Malheur County, processors used 94,882 thousand cwt during 2021, up 6 percent from the previous year.