Category: Non-Video

  • How Might Tomatoes Provide Health Benefits?

    How Might Tomatoes Provide Health Benefits?

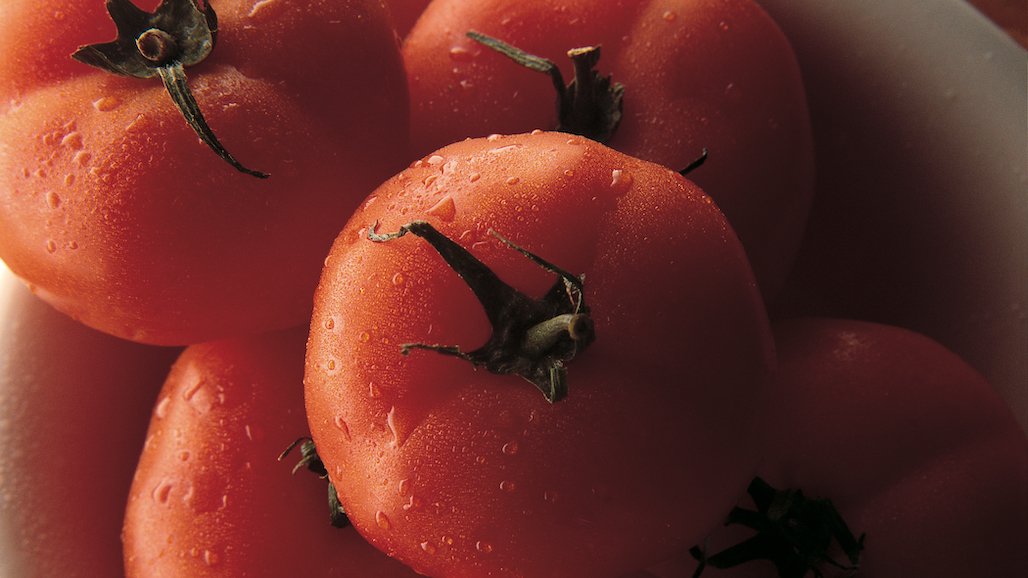
    (USDA Photo by Lance Cheung.)

    Scientists at U.S. the Department of Agriculture’s Agricultural Research Service (ARS) and The Ohio State University (OSU) have been working to investigate how tomatoes may be imparting health benefits in a recently published study.

    Studies in animals have shown that incorporating tomatoes into the diet can reduce the prevalence of chronic illnesses like prostate and liver cancer. It has been thought that compounds naturally produced by tomatoes are responsible for these effects. After absorption from a meal, many of the chemical compounds found in tomato fruits travel to the liver, where they are metabolized. Some compounds remain for some time, while others are quickly removed from the body.

    Meanwhile, in the liver or other tissues, some of these compounds can alter gene expression in ways associated with positive health benefits. Researchers in the past have largely focused on lycopene, a pigment that gives tomatoes their red color. However, tomatoes produce thousands of compounds, and it has been shown that tomato consumption offers more benefits than lycopene alone. A “big picture” view was missing.

    “We know that eating tomatoes is associated with a number of health benefits, and our study intended to dive deeper into what happens when you eat tomatoes from the standpoint of what is absorbed and how gene expression is altered,” said Michael Dzakovich Ph.D., a scientist with USDA-ARS Children’s Nutrition Research Center. “Rather than focusing only on one compound, we utilized a technology called metabolomics to broadly profile how hundreds of chemical compounds were changing in the liver as a result of tomato consumption. We also used transcriptomics to measure how all the detectable genes in the liver were changing at the same time. This approach gave us valuable insight into the potential mechanisms by which tomato consumption affects the liver and potentially the whole body.”

    Scientists tested liver tissue from mice that were fed control diets or control diets enriched with tomato to determine what tomato compounds were found in the liver and how gene expression changed. Tomato-fed mice were given one of two diets with the addition of commercial orange and red tomato varieties. Since not all tomato varieties are chemically identical, using multiple varieties allowed for a more comprehensive examination of how tomato consumption affects the liver in general.

    “We discovered a series of metabolites [molecules produced by metabolism] that have never been reported in the liver. Several of these compounds have been found in blood, skin, and urine, but our data show that these molecules are more extensively metabolized than we realized,” stated Dzakovich. The metabolites are from steroidal alkaloids uniquely produced in tomatoes.

    “Steroidal alkaloids have been shown in both in vitro [in the laboratory] and animal studies to lower the absorption of cholesterol, reduce cancer cell proliferation, and reduce muscle atrophy. They also resemble many important signaling molecules made by the body. It seems reasonable to hypothesize they might be a part of a suite of compounds found in tomatoes that benefit human health.”

    In addition, scientists observed that regardless of the tomato variety, there was an increase in the activation of genes related to xenobiotic metabolism, a series of biological processes that help our body detoxify itself. This led the authors to hypothesize that one way in which tomatoes may be benefiting human health is in their ability to promote production of the enzymes that allow excretion of potentially toxic compounds. Similar gene expression profiles have been associated with the prevention of cancer development because of consuming vegetables like brassicas (for example, broccoli).

    Michael Dzakovich initiated this study during his Ph.D. program in the laboratory of Jessica Cooperstone Ph.D. at The Ohio State University in collaboration with Mallory Goggans MS, Jennifer Thomas-Ahner Ph.D., Nancy Moran Ph.D., Steven Clinton MD Ph.D., and David Francis Ph.D. More details about this study can be found in Molecular Nutrition and Food Research.

    The Agricultural Research Service is the U.S. Department of Agriculture’s chief scientific in-house research agency. Daily, ARS focuses on solutions to agricultural problems affecting America. Each dollar invested in U.S. agricultural research results in $20 of economic impact.

  • Growing Chinese Market Demand for Nuts and Dried Fruit

    Growing Chinese Market Demand for Nuts and Dried Fruit

    USDA Foreign Ag Service — Thanks to consumers’ growing preference for healthy food and earlier successful marketing of nuts and dried fruit products across the country, China’s consumption and demand for nuts and dried fruit has exploded over the past few years. To continue this growth, new product innovations, packaging, and flavor concepts for nuts and dried fruit are needed.

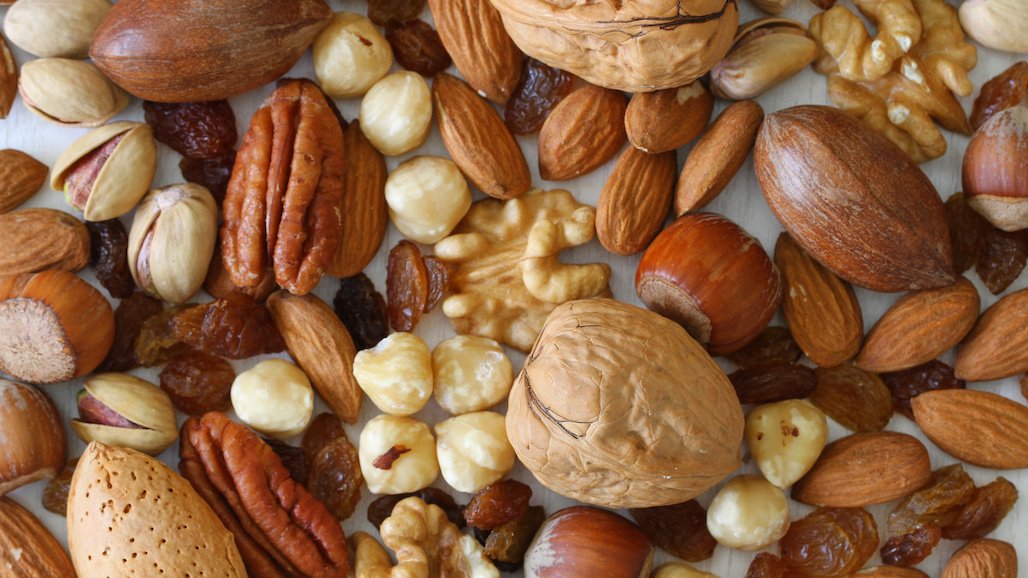
    In China, popular nuts and dried fruit include, but are not limited to, almonds, pistachios, pecans, walnuts, macadamia nuts, hazelnuts, dried cranberries, raisins, and dried blueberries. Recently, consumers have sought dried fruit and nuts because of their perceived health benefits, their versatile applications in food manufacturing, and their rich texture and appearance. In China, the “nuts market” segment includes tree nuts and dried fruit.

    Statistics from different sources indicate that the nuts industry has grown robustly over the past decade. Along with strong consumption and sales between 2012 and 2022, imports of nuts expanded substantially from $0.5 billion in 2012 to $3.3 billion in 2022, with record imports in 2021 of $3.5 billion.

    TREE NUTS & DRIED FRUITS MARKET SNAPSHOT

    •   The nuts market reached $40 billion in 2022, accounting for about 20 percent of the total snack food market, competing with candy/chocolate and biscuits/pastry for the number one sector.
    •   The compound annual growth rate for the nuts market was above 10 percent between 2011- 2022, making it a leading manufacturing industry in China.
    •   The tree nut market size reached $8 billion in 2022, remaining far behind seed nuts at $32 billion.
    •   Imports of tree nuts reached $3.28 billion in 2022.

    Imports of dried fruit also increased substantially over the past ten years, increasing from an initial $215 million in 2012 to $946 million in 2022, a 340 percent increase.

    The Popularization of Daily Nuts

    The concept of Daily Nuts originated from a product that was initially launched in 2016 by Wolong, a snack food manufacturer based in Qingdao. Although it is called Daily Nuts, it is a mixture of nuts and dried fruit, such as almonds, pistachios, dried blueberries, and dried cranberries. It is usually in small packs of 15-20 grams, perfect for nutrition supplements and at-work snacks.

    Unlike traditional roasted nuts, Daily Nuts target younger and higher-end consumers. Almost all the nuts and dried fruit used in daily nuts are imported to meet consumers’ high-quality expectations. While the raw ingredients are imported, the roasting, processing, and packaging occur domestically.

    Due to the strong marketing behind Daily Nuts, focusing on the nutritional benefits and portability of the product, the market exploded. Due to the quick expansion of Daily Nuts across China, Alibaba’s Tmall Research Institute created a new sub-sector called mixed nuts (which includes nuts and dried fruit) in 2017, and daily nuts were regarded as a representative of the sub-sector.

    Following the launch of Daily Nuts in 2016, the market size of mixed nuts and dried fruit grew from $1.4 billion in 2016 to $15.8 billion in 2021, a 1,029 percent growth.

    Consolidation of the Mixed Nuts Sub-Sector

    The booming sub-sector has led to market consolidation. Initially, more than 300 brands began selling daily nuts products in China. Big retailers such as Fresh Hippo, an affiliate of Alibaba, and Bian Li Feng, a nationwide franchised convenience store, even created their own daily nuts style private label products. However, recently smaller processors have begun manufacturing for bigger ones. In 2022, the combined market share of the top five brands, Three Squirrels, Haomusi, Wolong, Chacha, and Bestore, amounted to 38 percent; it is estimated that by 2028, the top five brands will expand their combined market share to 54 percent.

    Growing Online Sales

    The main category of consumers of mixed nuts and dried fruit are those aged 20 to 45, which directly corresponds to those consumers who most often utilize e-commerce channels. As a result, most of the sales for mixed nuts occur online. In 2022, 47 percent of all snack food sales occurred online. According to CFNA, in the first half of 2023, online sales of food products increased by 8.9 percent year-on-year. Additionally, new online livestreaming retailers, such as Douyin (Tiktok) and Kuaishou, are taking increasing market share from traditional offline retailers.

    Applications of Mixed Nuts in Food Manufacturing

    Tree nuts and dried fruits are typically used for three purposes: snack food, baking ingredients, and food/beverage ingredients. Although the applications of baking ingredients and food/beverage ingredients have been developing in recent years, the snack food sector has achieved impressive growth.

    The snack food sector includes three sub-sectors, namely single nuts, mixed nuts, and flavored nuts. The single nut sub-sector hosts traditional sunflower seeds, peanuts, hazelnuts, and imported tree nuts, which have become increasingly popular over the last two decades. Mixed nuts, as described in the daily nuts section above, are comprised of products with both nuts and dried fruit. Flavored nuts refer to nut products that are typically roasted, shelled, and then flavored to meet consumers’ personal flavor preferences. Typical flavors include but are not limited to salty, spicy, coconut, mustard and others.

    Sluggish Economic Recovery

    In 2022, strict COVID-19 zero-tolerance regulations impacted China’s economy. According to Tmall statistics, online sales of mixed nuts and dried fruit were nearly zero due to reduced logistics capacity. Offline, traditional sales fared even worse due to the same reduction in logistics capacity and frequent store closures. The economy was expected to rebound after lifting all COVID restrictions, but growth has remained sluggish.

    The overall reduction in spending means consumers are reducing purchases of non-essentials such as snack foods. In recent conversations with retail contacts, we learned that local consumers spending on snack food is only around 60 percent of pre-COVID levels. Although online food purchases increased by 8.9 percent in the first half of 2023, this is thought to be due to the increased sales of lower-cost products. The purchases of nuts and dried fruits, which consist of primarily imported raw ingredients and are more expensive, will continue to be impacted by China’s sluggish economic recovery.

    Declining Growth of Daily Nuts

    In the past few years, tree nuts and dried fruit sales were largely equal to sales of daily nuts products. While Daily Nuts initially led to an explosion in the market, the market is largely saturated. Thus, the market is calling for innovations in the nuts and dried fruit sector to spur growth.

    Booming international and domestic supplies

    China relies on imports of a range of nuts to meet its strong domestic demand. International supplies impact import volumes considerably. For example, with the production of U.S. almonds reaching a historic high in 2020/2021, the price fell substantially, which in turn led to increased exports to China. Increased international production may continue to lower global tree nut prices, making exports competitive.

    However, due to growing domestic supplies, imports of certain nuts and dried fruit are expected to decline. China is the largest producer of walnuts and peanuts globally and has a growing production of macadamia nuts, raisins, and blueberries.

    Over the past ten years, growing demand for nuts and dried fruit has pushed domestic production to record highs. According to CFNA, China’s total nut production in 2023 is 44 percent higher than five years ago.

    Growing domestic production has also decreased prices for dried fruit. For example, in August 2023, the domestic price for raisins was roughly half that of Chile and a quarter of that of the United States.

    Other Promising Products

    Aside from products used for mixed or daily nuts, other dried fruit products are seeing market growth. For instance, local consumers perceive dried prunes as a good source of dietary fiber, translating into increased sales.

    Additionally, growing consumer health consciousness and the still-to-be-explored versatility of nuts and dried fruit in the food manufacturing sector will likely spur market growth. While the previous high growth rates were not sustainable, mild but steady growth is expected.

    New Product Development

    With the saturation of the market for daily nuts, food researchers and developers are making every effort to develop a product with the market power of daily nuts. Potential new uses of nuts and dried fruit could include:

    •   In a beverage
      o Example: Six Walnuts bottled drink, a walnut milk beverage, saw high sales upon its launch due to improved taste and brand image.
    •   In the food manufacturing sector

    o New processed and value-added products such as sliced, diced, minced nuts, or sugared, pureed, marinated fruit, could be used to meet different food manufacturing requirements or demands.

    o China’s expanding food manufacturing industry is calling for more varieties of processed ingredients, offering new market opportunities.

    Identifying and capitalizing on these market opportunities will require more collaboration between suppliers and R&D departments of Chinese food manufacturers in testing and educating the market.

     In chain coffee and milk tea shops
    o Recently, nuts, and dried fruit consumption have increasingly been used for beverages at chain coffee and milk tea shops across China.

    o This demand comes from two usages: one is a small pack of nuts and dried fruit consumed alongside coffee or milk tea, and the other is used as ingredients for baking and pastries in coffee or milk tea shops.

    o Neither of these uses is new, but the demand and consumption have grown substantially in line with the rapid expansion of coffee and milk tea shops.

    For more information, please contact ATO Beijing:

    USDA Agricultural Trade Office in Beijing U.S. Embassy, Beijing, No. 55 An Jia Lou Road Chaoyang District, Beijing
    China, 100600
    Tel.: 86-10-8531-3950
    Fax: 86-10-8531-3974
    Email: atobeijing@usda.gov

  • UCCE 58th Annual Sweetpotato Meeting

    UCCE 58th Annual Sweetpotato Meeting

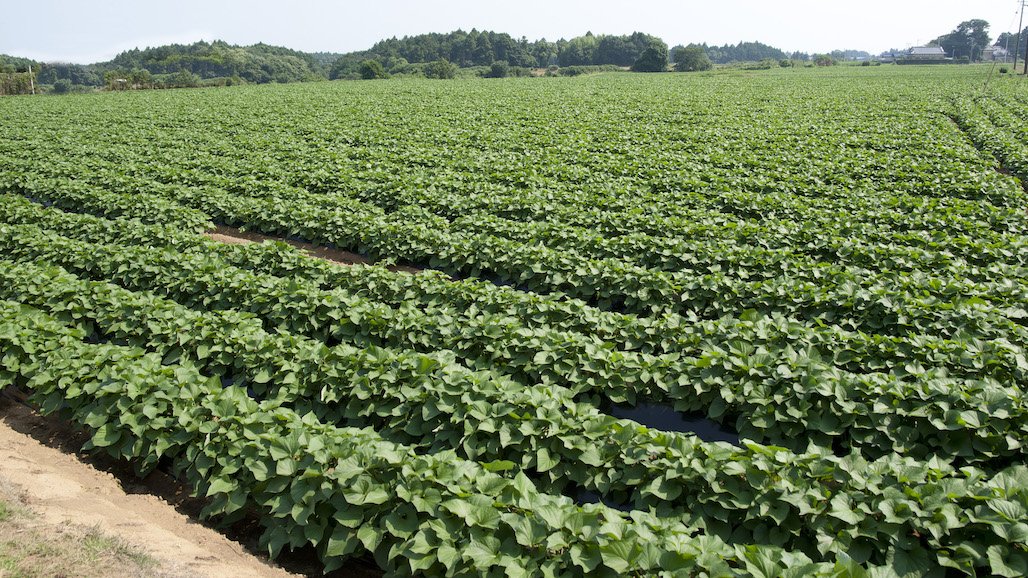
    Save the date, Thursday February 8, 2024, for the UC Cooperative Extension 58th Annual Sweetpotato Meeting to take place at the UCCE Classroom (2145 Wardrobe Ave., Merced).  Growers and industry stakeholders are invited to attend and gain research updates on sweetpotato production and marketing in California. Doors open at 7:30 a.m. where attendees can sign-in, and enjoy some coffee and Jantz Sweetpotato muffins.  The meeting will run from 8AM to noon, and conclude with lunch.  Following lunch, the Sweetpotato Council of California will convene their BOD Meeting.  See the Annual Sweetpotato Meeting agenda below:

  • New UC Studies Estimate Production and Harvest Costs for Coastal Apples

    New UC Studies Estimate Production and Harvest Costs for Coastal Apples

    Two new studies that can help Central Coast growers and other readers estimate costs and potential returns for organically and conventionally produced apples for processing were recently released by University of California Agriculture and Natural Resources, UC Cooperative Extension and the UC Davis Department of Agricultural and Resource Economics.

    “These studies provide growers with a baseline to estimate their own costs, which can help when applying for production loans, projecting labor costs, securing market arrangements, or understanding costs associated with water and nutrient management and regulatory programs,” said Brittney Goodrich, UC Cooperative Extension specialist and co-author of the studies.

    The new studies, “2023 Sample Costs to Produce and Harvest Organic Apples for Processing” and “2023 Sample Costs to Produce and Harvest Apples for Processing,” can be downloaded for free from the UC Davis Department of Agricultural and Resource Economics website at https://coststudies.ucdavis.edu.

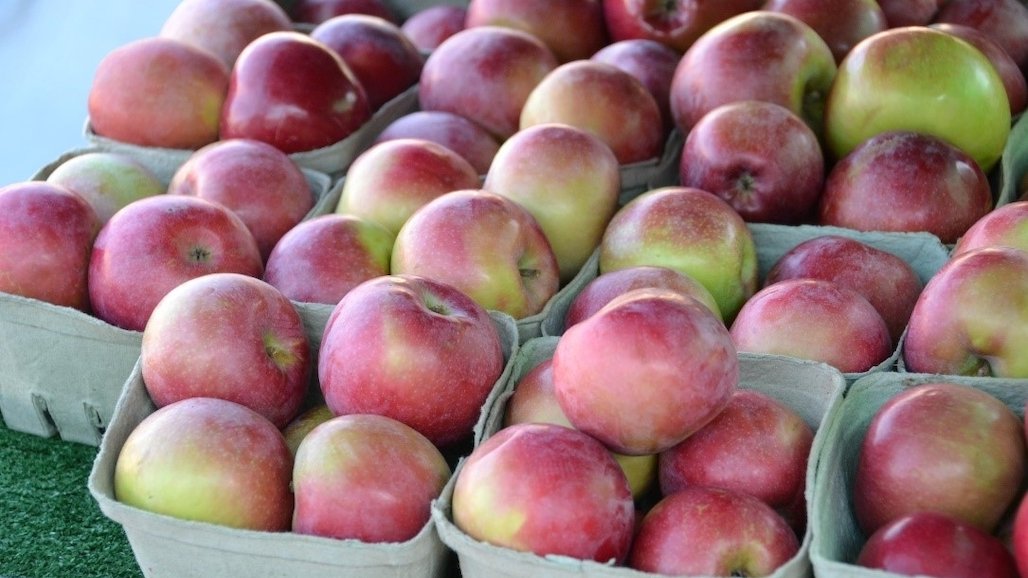
    The studies focus on processing apples, not fresh market apples, which makes a difference in farming practices. Apples grown for processing on the Central Coast are mostly pressed for juice and sparkling cider.

    “Ready-to-eat means that looks matter – blemishes and so forth are a big deal. Juice not so much, it all gets smushed in the end,” said co-author Mark Bolda, UC Cooperative Extension farm advisor for Santa Cruz, Monterey and San Benito counties. “Varieties grown here are Gala, Newtown Pippins, Mitsui and some Granny Smith.”

    The cost studies model a management scenario for a 100-acre farm, 20 acres of which are planted to a mature orchard that produces apples for processing. The remaining acres are planted to apples not yet in production, caneberries, strawberries and vegetables. In each study, the authors describe the cultural practices used for organically or conventionally produced apples, including land preparation, soil fertility and pest management, irrigation and labor needs. Harvest costs are also shown.

    In six tables, they show the individual costs of each operation for apples, material input costs, and cash and non-cash overhead costs in a variety of formats. A ranging analysis shows potential profits over a range of prices and yields.

    For a detailed explanation of the assumptions and calculations used to estimate the costs and potential returns for each crop, readers can refer to the narrative portion of each study.

    For more information, contact Mark Bolda at mpbolda@ucanr.edu; Laura Tourte, emeritus UCCE advisor, at ljtourte@ucanr.edu; or Jeremy Murdock of UC Davis Department of Agricultural and Resource Economics at jmmurdock@ucdavis.edu.

    Sample cost of production studies for many other commodities grown in California are also available for free at https://coststudies.ucdavis.edu.

    UC Agriculture and Natural Resources brings UC information and practices to all 58 California counties. Through research and Cooperative Extension in agriculture, natural resources, economic growth, nutrition and youth development, our mission is to improve the lives of all Californians. Learn more at ucanr.edu and support our work at donate.ucanr.edu.

  • Citrus Greening (HLB) Impacting Brazilian Citrus Crop – Annual Report

    Citrus Greening (HLB) Impacting Brazilian Citrus Crop – Annual Report

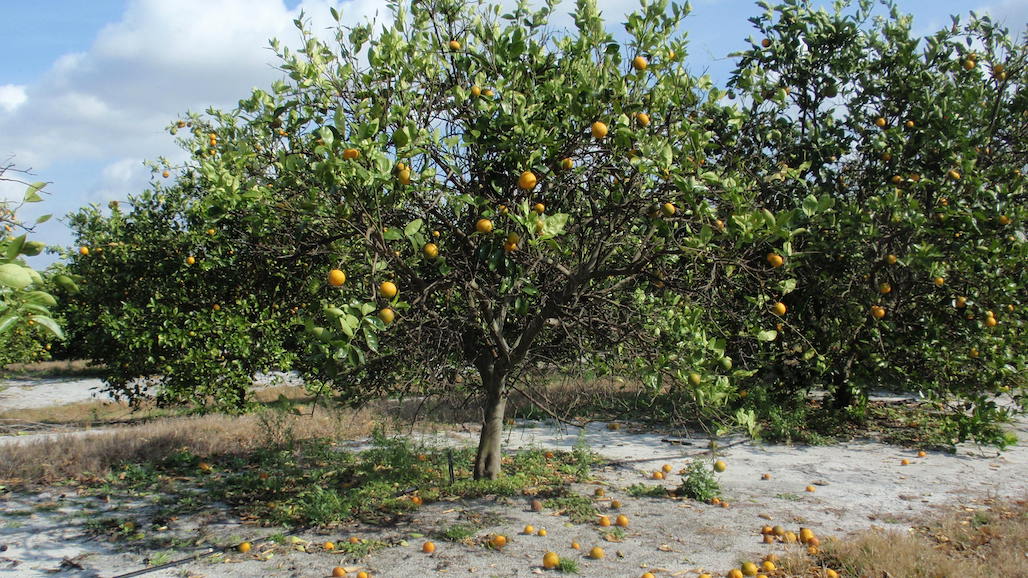
    The Brazilian orange crop for Marketing Year (MY) 2023/24 is forecast at 408 million 40.8-kg boxes (MBx) – standard reference, equivalent to 16.5 million metric tons (MMT), a decrease of 1.03 percent compared to the estimate of current crop MY 2022/23 (around 412.3 million boxes or 16.67 MMT), due to the incidence of greening, which has been affecting Brazil’s citrus belt. Meanwhile, the average fruit weight is expected to be 158 grams for MY 2023/24, as a result of unfavorable climate and diseases, with expectations of lower production and fruit quality. FCOJ 65 Brix equivalent production for MY 2023/24 is forecast at 1.05 MMT, a decrease of 1.64 percent vis-à-vis the estimate for MY 2022/23 (1.12 MMT), due to downward expected availability of fruit for processing provoked by extremely high temperatures and the greening incidence. A significant share will keep supplying the U.S. market due to limited juice availability from Florida provoked by hurricane Ian.

    FRESH ORANGES

    PS&D Table

    The following table provides total Brazilian fresh orange production, supply, and distribution (PS&D) for Brazilian (BR) marketing years (MY, July-June) 2022/23, 2023/24, and 2024/25. The MY mentioned above are equivalent to U.S. MY 2021/22, 2022/23, and 2023/24, respectively.

    Table 1

    Production, Supply and Distribution for Brazilian Fresh Oranges

    Note: There is a one-year lag between the BR MY and the U.S. MY. For example, BR MY 2023/24 is equivalent to U.S. MY 2022/23. To ensure data continuity, the current Brazilian MY 2023/24 will be referred to as U.S. MY 2022/23 throughout this report.

    General

    Post forecasts the total Brazilian orange crop for MY 2023/24 (July/June) at 408 million 40.8-kg boxes (MBx) – standard reference, equivalent to 16.5 million metric tons (MMT), a decrease of 1.03 percent compared to current Post estimate for MY 2022/23 (412.3 million boxes or 16.67 MMT), due to greening incidence.

    The commercial area of the state of São Paulo and the western part of Minas Gerais (known as “Triângulo Mineiro”) should produce 307 million 40.8-Kg boxes (12.52 MMT) for MY 2022/2023, a projection based on the most recent data released by the Defense Fund for Citriculture (Fundecitrus) in December 2023. Considering the total citrus belt estimated production, approximately 27.60 million boxes should be harvested in the Triângulo Mineiro region, as reported by Fundecitrus, and 280 million boxes in São Paulo.

    Around 30 percent of Brazil’s orange production is destined to the market and 70 percent is used for juice processing. The main orange varieties that Brazil produces are Hamlim, Westin, Rubi, Valencia Americana, Seleta, Pineapple, BRS Alvorada, Pera Rio – pear orange, Valencia, “Folha Murcha” Valencia, and Natal. The citriculture chain in Brazil is highly industrialized.

    Figure 1

    Orange Production History in the Brazilian Citrus Belt

    The graph above (Figure 1) shows the orange crop production history in the Brazilian citrus belt, reflecting significant oscillations over the course of twenty-four years, ranging from 450 million 40.8Kb boxes in BR MY 1999/00 to 250 million BR MY 2010/11. During its big harvests, the Brazilian citrus belt produced an average of 400 million boxes, particularly in BR MY 2011/12, 2012/13, 2017/18, 2019/20. However, in the past four market years, the average has fallen around 100 million to an average of 300 million.

    According to Post contacts, the current average of orange boxes produced in the Brazilian citrus belt reaches 915 boxes per hectare, even though some larger citrus growers produce 2,000 boxes per hectare due to the following reasons: 1- adapted varieties (more productive plants) and a mix of varieties (early oranges are very productive, compared to the others, mid-season and late); 2- densification of orchards (in the 1980s there were around 250 trees/ha. now there are about 700 trees/ha); 3- pruning and management techniques for better productivity and more day-to-day management. Today, 70 percent less pesticides are used in each pesticide application.

    Data from Fundecitrus shows an estimate to the weight of oranges at 160 grams (255 fruits per box) upon the current harvest, representing an increase of 3.77 percent in relation to the average weight recorded in the previous crop MY 2021/22, and a 1.23 percent growth in average weight when compared to the last ten crops.

    Production

    According to data from the Brazilian Institute of Geography and Statistics – IBGE in November 2023 citrus is produced in Brazil on 584,443 hectares. The citrus belt accounts for approximately 83 percent of the cultivated area in Brazil. Taking into account the estimated 307 million of boxes produced in the Brazilian citrus belt in MY 2022/23, post contacts inform that 300 million are produced in São Paulo and Minas Gerais regions, of which 50 million are in natura and 250 million are used for processing. According to Fundecitrus, the second half of 2023 has observed Minas Gerais producing more than Florida. Approximately 27.02 million boxes are expected to be produced in the Triângulo Mineiro region for MY 2022/23, against 16 million boxes in Florida.

    In Brazil, citrus growers plant and sell according to market demand, many of them through juice industry contracts. The citrus belt, however, also has the highest incidence of plants with symptoms of the main citrus disease, greening (or Huanglongbing – HLB). According to data published by Fundecitrus in 2023, 38 percent of the plants in the citrus belt have symptoms of the disease.

    Rainfall was frequent and voluminous from January to April 2023 throughout the São Paulo citrus belt, making MY 2022/23 orange crop produce fruit with good size development. Moreover, the decrease in the estimated production of pear orange in the citrus belt is being offset by an increase in the production of early varieties. Recent data from Fundecitrus reports that oranges of the early varieties benefited from the abundant rainfall in the beginning of 2023, which resulted in an estimate of 2.27 million boxes. The other varieties (Pera Rio, Valencia, Valencia Folha Murcha and Natal) have an estimate down by 4.39 million boxes, due to the size of the fruit, smaller than expected.

    Throughout 2023, temperatures reached astonishing numbers, ranging from 95°F to 104°F. The process known as “evapotranspiration”, by which the land transfers water and plants transfer transpiration to the atmosphere, is higher as the heatwave increases. With the arrival of the dry season from May 2023 to August 2023, rain became scarce in the citrus belt region in São Paulo, falling 26 percent below the average, causing the trees to suffer from drought stress.

    According to the Brazilian Economic Research Center (CEPEA), throughout 2023, many oranges were withered and sunburned, varieties that consumers do not usually buy. To avoid those fruit conditions and premature fruit fall, many producers anticipated the harvest of late varieties, mainly Valencia and Natal. Abundant rain in October 2023 relieved drought stress, but the availability of oranges on the fresh market remained restricted.

    A heatwave that hit the state of São Paulo in November 2023 caused partial fruit abortion, which is when the fruit falls off before the final filling stage. This happens so that the tree does not die. At high temperatures, the fruit’s stomata close – the structure that ensure gas exchange -, automatically reducing photosynthesis and negatively impacting the production.

    In irrigated areas damages tend to be mitigated, since orange flowers are more advanced. These areas are in the north of São Paulo state, where temperatures are usually higher. Irrigation facilitates planting, since the regular rainfall cannot always be proper for crops, and it can reduce the risk of high temperatures. According to Fundecitrus, the practice of irrigation is considered a complementary strategy. There are around 36 percent of irrigated hectares in the citrus belt and 63 percent of non- irrigated hectares, or hectares without information on irrigation.

    Fundecitrus emphasized in its most recent orange crop forecast from December 2023 that the citrus belt harvest reached 82 percent of production in the middle of November 2023, 26 percent faster compared to previous years. To produce oranges all year round, nine months of harvest are needed, which runs from May to February.

    With El Niño in Brazil, heat waves started in June 2023. High temperatures and rain shortage in the Brazilian citrus belt is expected to continue to be a cause of concern for the next harvest (MY 2023/24), according to Post contacts. According to the U.S. National Oceanic and Atmospheric Administration (NOAA), along with its National Weather Service and funded U.S. institutions, an El Niño forecast from November 2023 has a 62 percent probability of continuing until April or June 2024.

    Figure 2

    Maximum Daily Temperate in Brazil, Dec 4-10, 2023

    A compilation of surveys by Brazilian institutions, including the Brazilian National Institute of Meteorology, released in November 2023 a newsletter on El Niño. The climate forecast for December 2023/January-February 2024 indicates a greater likelihood of temperatures above the normal range in most of the country, including the citrus belt area.

    The Brazilian map in Figure 2 on the left highlights the current behavior of high temperatures in Brazil (Dec 4-10), showing evidence that El Niño may worsen the temperature oscillations in most of Brazil. In the citrus belt area, red color shades on the map indicate temperature ranging from 86°F to 104°F.

    Area

    Post forecasts the area planted for oranges at 590,000 ha for MY 2023/24, 10,000 ha downward compared to Post current estimate for MY 2022/23 (600,000 ha), due to densely cultivated plants.

    São Paulo is the only state that compiles trees planted and tree inventory data. According to Crop Forecast Survey data from Fundecitrus (PES in Portuguese) from May 2023, bearing trees total 169.29 million and cover an area of 399,415 hectares in the citrus belt. This represents an increase of 0.41 percent in the number of trees over the previous, released in 2022.

    Even though the whole country produces oranges, the Brazilian map in Figure 3 bellow shows the main citrus-growing regions in Brazil, according to data from IBGE (2022). It denotes the states of Bahia (3.39 percent); Paraná (3.88 percent) and Rio Grande do Sul (2.11 percent) as the main orange production states outside of the Brazilian citrus belt (76.94 percent in São Paulo and 6.44 percent in Minas Gerais).

    Figure 3

    Main Citrus-Growing Regions in Brazil

    Data on the map in Figure 4 below covers the area of land planted with orange trees in each of the twelve regions that make up the five sectors of the citrus belt: North, Northwest, Central, South and Southwest. Variation in area is indicated by colors. The darkest color, for example, in navy blue, denotes regions where there are the most land in used for orange tree planting, including, among other municipalities, Avaré, with 58,824 ha and Duartina, with 60,446 ha. Meanwhile, there are 12,169 ha in Altinópolis and 11,570 in Brotas, highlighted in the map by the lightest shade of orange.

    Figure 4

    Brazilian Citrus Belt per Region

    Currently in Brazil there are a total of 5,134 orange grove properties, most of them large producers with high productivity. In addition to pests, high production costs and an insufficient labor force has driven many small producers away from the industry. As reported by Post contacts, it costs around BRL 40 million to invest in a citrus farm.

    The current scenario makes it increasingly likely that citrus farming, especially on small and medium farms, will be converted to other crops, such as sugar cane in the São Paulo region or livestock farming. The main reason is because the production of sugar cane in São Paulo is less risky than that of oranges. Moreover, there are already mills in the São Paulo region, making it easier to switch the production to a new commodity. Thus, prices of other crops may define the fate of the Brazilian citrus industry in the coming months. Fundecitrus highlights, however, that the production of oranges requires a smaller area for production, compared with other crops. Orange production compared with sugarcane, for example, has an area 14 times smaller and a profitability of around 2.5 times higher.

    In the long term, Post contacts report that the trend of the orange industry expanding outside the São Paulo and Minas Gerais area is likely to continue. In the state of Bahia, for example, the greening disease does not exist, due to the climate and the distance from the main region of the citrus belt.

    The next couple of years will be crucial to determine which new areas Embrapa considers to be promising for citrus planting in the so-called expanded citrus belt. Besides taking climate risk into account, agricultural planning for planting and producing citrus in new areas must include the use of healthy seedlings produced in a protected environment.

    Recent studies conducted by Fundecitrus and Embrapa funded by Innocent Drinks, a British-based company that produces smoothies and juice, have found that the entire citrus belt holds a stock of approximately 36 million tons of carbon, equivalent to 133.4 million tons of carbon dioxide (CO2). This is the same emitted by the city of São Paulo in around eight years. The absorption of the gas can contribute to reducing the impacts of global warming, according to Embrapa, since the agricultural land functions simultaneously as the source and the drain for carbon, while stabilizing and securing fauna in the citrus farming areas.

    Tree Inventory and Yields

    For MY 2023/24, Post forecasts 1.80 boxes/tree, a decrease of 1.1 percent from the estimate for MY 2022/23 (1.82 boxes/tree) due to the potential negative impacts of greening and El Niño. Total Brazilian tree inventory for MY 2023/24 is forecast by Post at 240 million trees and estimated at 240.5 million trees for MY 2022/23. The decrease is mainly expected in the São Paulo commercial citrus belt.

    The graph from Figure 5 below shows the current yield estimate from Fundecitrus for MY 2022/23, with a total of 1.83 boxes/tree embracing all five regions of the citrus belt. The north stands out as the most productive region, with 2.26 boxes/tree estimated.

    Figure 5

    Yield Estimate in the Brazilian Citrus Belt

    Post forecasts the average fruit weight in the Brazilian citrus belt for MY 2023/24 to be 158 grams, as a result of unfavorable climate and disease impact, with expectations of lower production and fruit quality. Moreover, Post forecasts 258 fruits to fill a 40.8-Kg/90-pound box. Considering all orange varieties, Fundecitrus reports that it is estimated 255 fruits to make up a 40.8-kg box for MY 2022/23 in the citrus belt. For that amount, oranges weight is estimated at 160 grams, in contrast to the previous projection of 165 grams…

    Read the full USDA Foreign Ag Service report HERE.
  • EU Faces Domestic Olive Oil Shortage

    EU Faces Domestic Olive Oil Shortage

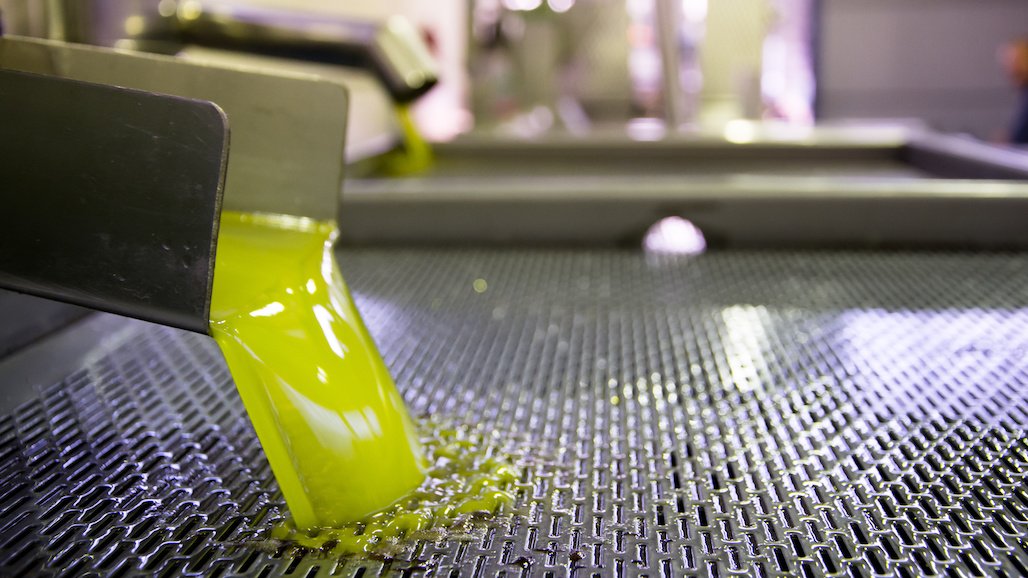
    In MY 2023/24, the EU is facing a second consecutive short olive oil production crop. Consumer price increases resulting from the limited domestic availability will contribute to reduced consumption. The short crop will also preempt exports from expanding for the second consecutive year, while also continuing to push stock levels down.

    Production, Supply, and Demand

    Production

    Source: FAS Europe Posts.

    N.B.: Post trade and production data include only HS Code 1509.

    Estimates based on precipitation levels to date, temperatures during the olive trees flowering season, and the subsequent extreme summer heat waves that resulted in unripe fruit dropping, indicate that the European Union’s (EU) olive oil output in MY 2023/24 could amount to just above 1.4 million Metric Tons (MT).

    Olive harvest in the EU runs from fall to the beginning of spring. While spring conditions determine flowering and summer temperatures influence fruit development, fall precipitations still play a role in final output levels. Olive tree’s alternative bearing also plays a role in production volumes. New plantations under irrigation entering production also continue to soften the impact of alternative bearing in olive oil production levels across the EU. The EU’s olive oil production is concentrated in a handful of Member States. The EU is the world’s largest olive oil producer, accounting for over 60 percent of the world production.

    In Spain, which produces about half of the world’s olive crop, extreme weather conditions resulted in short production for a second year. After a spring heat wave impacted flowering, the harvest in Spain was forecast to be only 15 percent larger than last year, which was the worst olive oil production year in nearly a decade. A series of summer heat waves caused trees to drop unripe fruit to conserve moisture. However, abundant fall precipitation contributed to improve the initially negative production outlook. The latest official estimates indicate that olive oil production in Spain in MY 2023/24 may reach up to 765,200 MT.

    In Italy, MY 2023/24 olive oil production is forecasted at 300,000 MT, mainly due to the promising conditions in the regions of Puglia, Calabria and Sicily, which account for approximately 70 percent of the country’s olive oil production.

    Greece’s MY 2023/24 olive oil production could be as low as 180,000 MT. The mild winter did not favor flowering and extensive rainfall in spring further reduced fruit-set. Additionally, extremely hot summer conditions followed by autumn rainstorms ‘Daniel’ and ‘Elias’ reduced the yields in the central Greece area. Chalkidiki in the north and Crete in south Greece also report significant olive oil production decreases.

    Consumption

    MY 2023/24 and MY 2022/23 olive oil consumption has been revised down compared to previous estimates in response to soaring EU olive oil consumers’ prices in the main producing and consuming countries. Likewise, olive oil prices in producers’ markets in the EU also far exceed previous season’s levels.

    Trade

    The second consecutive short EU olive oil crop is expected to limit the bloc’s export potential in MY 2023/24. The EU’s total olive oil export levels in MY 2022/23 also declined significantly, driven by the limited domestic availability. The United States followed by Brazil are the main destinations for EU olive oil exports.  Read the full USDA-Foreign Ag Service Report HERE.

  • Mexican Blueberry Acreage & Production on the Rise

    Mexican Blueberry Acreage & Production on the Rise

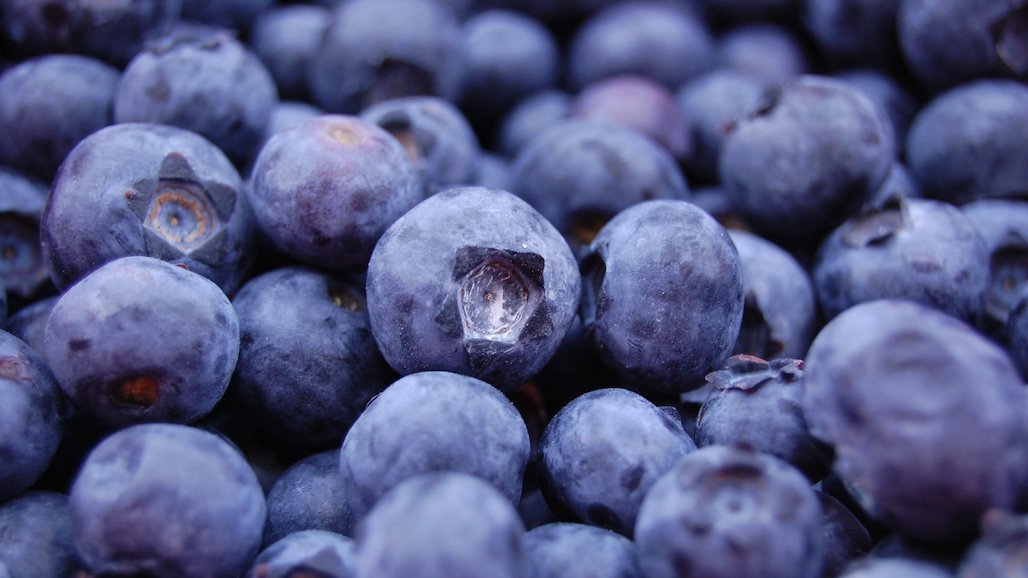
    Mexico’s 2024 blueberry production is forecast at 81,000 MT, an eight percent increase over 2023 on sufficient water access and growing export demand. The rate of production growth is projected to be slower in 2024 compared to 2023 due to competition from Peru. Production in 2023 reached an estimated 74,800 MT, a twelve percent increase over the previous year due to production innovations and strong export demand. Blueberry exports totaled 71,509 MT in 2022, down about two percent compared to 2021. Imports reached 13,715 MT in 2022, a ten percent decrease from the previous year. The United States is Mexico’s top blueberry export market, with a nearly 97 percent share.

    Executive Summary

    Mexico’s blueberry sector has seen rapid growth in the past decade, with increasing prices encouraging growers to expand production or switch from other crops to blueberries. Production grew over 80 percent between 2017 and 2022, reaching 66,847 metric tons (MT), making Mexico the world’s fifth largest blueberry producer.

    Mexico’s per capita blueberry consumption is barely 70 grams per year, constrained by price as well as consumer preference, with blueberries not occupying a place in traditional Mexican cuisine.

    In 2022, Mexico’s total blueberry exports totaled 71,509 MT, down about two percent compared to 2021. By value, blueberry exports totaled USD 629 million in 2022. Imports reached 13,715 MT in 2022, a ten percent decrease from the previous year. While both import and export volumes decreased in 2022 compared to 2021, rising blueberry prices pushed up trade value, with both imports and exports increasing about seven percent by value from 2021 to 2022.

    The United States is Mexico’s top blueberry export market, with a nearly 97 percent share, valued at USD 607 million. Other export destinations include the Netherlands, Canada, Germany, the United Kingdom, Japan, Hong Kong, and Singapore. The U.S. is also Mexico’s number one blueberry supplier.

    Production

    Mexico’s calendar year (CY) 2024 blueberry production is forecast at 81,000 MT, an eight percent increase from forecast 2023 production based on expected adequate access to water and growing demand from international markets, predominantly the United States. Despite drought conditions throughout Mexico, local producers report that the berry sector will avoid the impact of water shortages in the near term (1-3 years). The sector is well-equipped with highly efficient irrigation systems, including private reservoirs, and ample operating funds.

    Production growth is projected to remain strong in 2024, although not as as robust as in 2023 due to a shortened growing and harvest season. Historically, Mexico’s harvest began in early October, peaking between late April and early May. In contrast, industry sources report that for the 2024 harvest, producers have taken steps to delay the start of the harvest to early February in response to competition from Peru, which offers a similar product at lower prices during the October-January period. Faced with this competition, Mexican growers have shifted the growing season by delaying new plantings, which is projected to dampen overall prodution given the relatively significant place of new plantings in total planted area, with the sector currently undergoing a transition from Biloxi to proprietary varieties. Producers are actively switching away from the Biloxi variety to take advantage of the ongoing development of improved varieties that provide higher yields and better taste. According to farmer contacts, 23 percent of blueberry area is currently planted with the Biloxi variety and 74 percent is planted with proprietary varieties, and they expect the share of Biloxi to decrease significantly in the near term. In addition to delaying new plantings, Mexican producers report that they are delaying fertilizer applications as another technique to push the harvest beyone the Peruvian harvest period.

    Blueberry production in 2023 reached an estimated 74,800 MT, a twelve percent increase over the previous year due to the use of improved varieties and other innovative production technology as well as strong export demand.

    According to data from Mexico’s Agri-food and Fisheries Information Service (SIAP), blueberry production totaled 66,847 MT in 2022. Beginning in 2023, SIAP stopped reporting official blueberry data, for reasons that are not publicly available.

    Mexico’s blueberry sector has been growing steadily in recent years, realizing a production growth of over 80 percent between 2017 and 2022. During this period blueberry planted area grew from 3,642 hectares (ha) to 4,444 ha, a 22 percent increase. Mexican blueberry exporters benefit from geographical proximity to the United States, with shipments reaching the U.S.-Mexico border in 18 hours or less. Berries are shipped to the U.S. market by truck daily. In addition, Mexico is able to provide blueberries during the off-season periods for other major producing countries, particularly the United States. Further, producers benefit from sustained investment to take advantage of growing export opportunities. Access to improved infrastructure and production methods enables growers to achieve greater yields and protect their crops against risks from pests, extreme weather, and other climate impacts. Read the full report from USDA Foreign Ag Service HERE.

  • Filling in the Blanks About Rose Stem Girdler in Caneberries

    Filling in the Blanks About Rose Stem Girdler in Caneberries

    Berry farmers are all too familiar with the rose stem girdler (RSG), an invasive insect from Eurasia that came to North America over a hundred years ago. They know that the copper-colored beetle has migrated to the Pacific Northwest. They know it attacks caneberries — blackberries and raspberries — sometimes ravaging up to 90% of a crop and forcing farmers to replant fields.

    What they may not know is when or where it will strike or how to contain it.

    Now, however, researchers at Washington State University (WSU) may be on the verge of providing a breakthrough by developing a coordinated approach to control RSG; an approach known as integrated pest management. The project was funded by the Northwest Center for Small Fruit Research, , an  Agricultural Research Service-led consortium, to gather information about RSG and then develop tools that growers could employ against it.

    According to Justin O’Dea, a WSU regional agriculture specialist, one such tool is a pest emergence model that will help farmers precisely time their insecticide sprays to be most effective. The model helps predict when RSG, which overwinter as larvae inside the stems of berry plants, emerge into the outside world as adult beetles.

    A major concern with controlling RSG is the insect’s innate unpredictability, O’Dea said.

    “Damage from this pest is commonly intermittent and variable, which blindsides berry growers when infestations flare,” he said. “This can lead to growers making ineffective, pre-emptive sprays to try and make sure they are not blindsided again.”

    The recent discovery of a natural predator of RSG — a parasitoid wasp known as Baryscapus rugglesi – is also now in the integrated pest management toolkit, although its efficacy is not yet fully known. Parasitic wasps lay their eggs inside other insect species, killing the host insect in the process. As a result, these wasps are used extensively, worldwide, to control pest insect populations in agriculture.

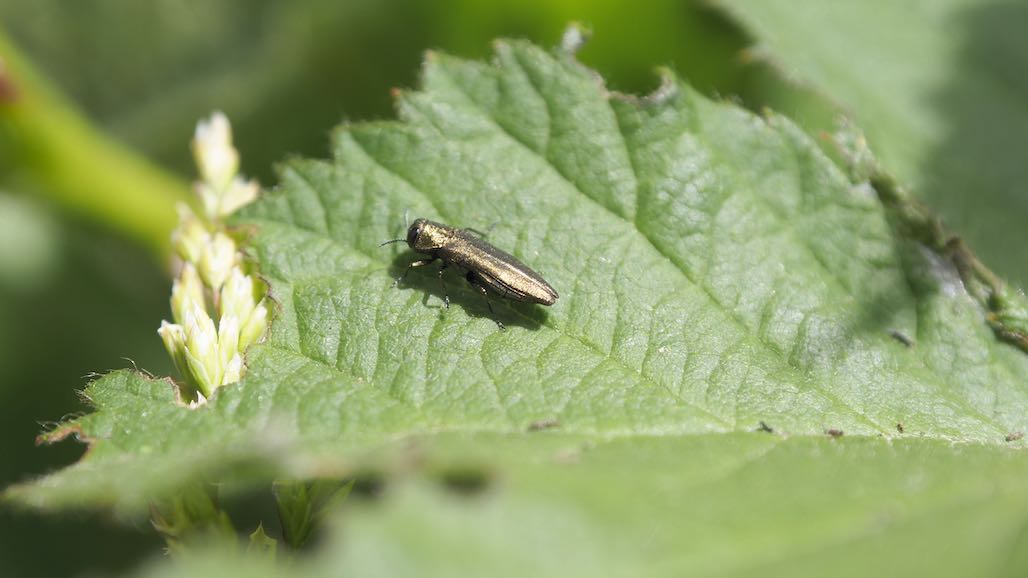
    An adult rose stem girdler beetle feeds on a blackberry leaf. (Photo by Justin O’Dea, Washington State University)

    “We know now that we have a parasitoid of RSG [in the Pacific Northwest] and have observed periods where RSG appears to decline inexplicably,” O’Dea said. “This phenomena of RSG pest pressure decline may be at least partly due to parasitism. If so, perhaps parasitoids will eventually lead to RSG becoming less of an important threat to caneberries in the Pacific Northwest, but only time and further research will be able to confirm that.”

    In the meantime, or at least until late spring when the emergence model predicts RSG adulthood, O’Dea said there is something that farmers can do to help prevent infestation: prune. This step is important because, after hatching, RSG larvae burrow into the canes where they feed on water, nutrients, and sugars moving through the plant’s vascular system. The larvae will eventually bore into the middle (the pith) of the cane.

    Thoroughly pruning out all canes that show symptoms of RSG damage (cane swelling, wilting, or breakage) can be done at any point before the pest emerges. The damaged canes should be removed from the field and burned.

    “This strategy [is] part of an effective integrated pest management program,” O’Dea said. “Research in Utah found this method to be about 80% effective. When combined with insecticides, RSG control could be as high as 98%.”

    Successful development of an integrated pest management program for RSG means that growers will have a better chance at minimizing the need for insecticide applications, O’Dea said. That equates to reduced time, energy, and money spent on ineffective and unnecessary insecticide applications, as well as reduced risk to pollinators and other inadvertent impacts to the environment.

    “Based on historical records of how RSG has played out in other regions of the country and our own observations, I’m cautiously hopeful that it will become a limited threat in the long run,” O’Dea said. — By Scott Elliott and Jan Suszkiw, USDA-ARS Office of Communications

  • UC Strawberry Production Research Meeting, Feb. 14

    UC Strawberry Production Research Meeting, Feb. 14

    Join UC Farm Advisor Mark Bolda and other University and field experts in this virtual meeting to learn about the latest research and advances in strawberry production. Anyone directly involved with the production of strawberries is invited to attend. Live Spanish translation will be available. We will discuss issues pertaining to production of strawberry and provide updates on current research addressing those issues. Continuing Education Credits from CA DPR are pending approval. Register to attend HERE.

    Contacts for More Information
    Logistics: UC ANR Program Support, 530-750-1361 (messages only)

    Program: Mark Bolda, UCCE Farm Advisor

  • 2023 Cost of Production for Fresh Market Raspberries Report

    2023 Cost of Production for Fresh Market Raspberries Report

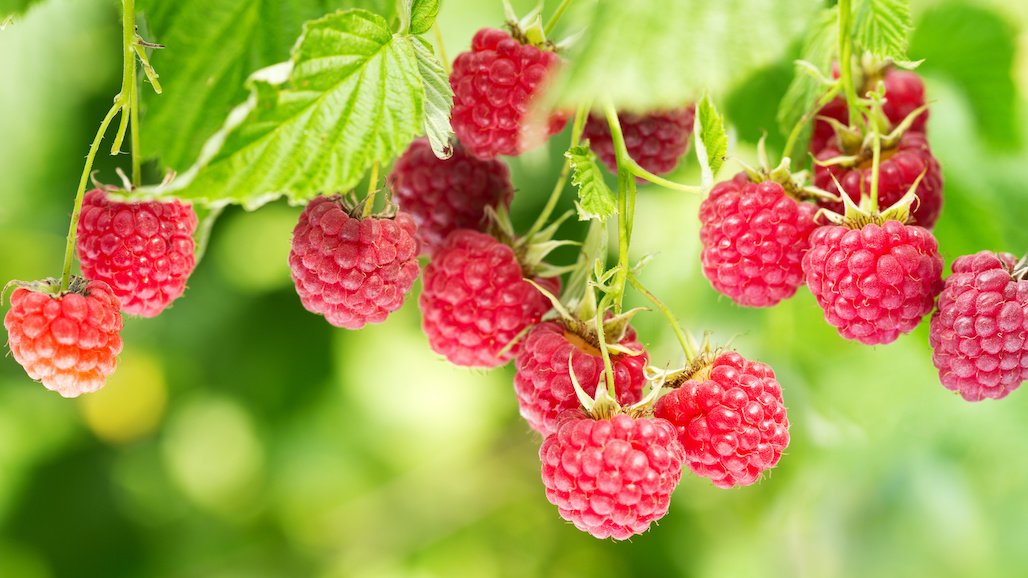
    The UC Cooperative Extension has released its 2023 Cost of Production for Fresh Market Raspberries report.  The sample costs to establish, produce, and harvest raspberries in Santa Cruz, Monterey, and San Benito Counties are presented in the following study. The study is intended as a guide only, and can be used to make production decisions, determine potential returns, prepare budgets, and evaluate production loans. The practices described are based on production and harvest procedures considered typical for this crop and area and may not apply to every farm. Sample costs for labor, materials, equipment, and custom services are based on current figures.

    The hypothetical farm operation, production practices, overhead, and calculations are described under assumptions. For additional information or explanation of calculations used in the study, contact Mark Bolda, mpbolda@ucanr.edu, or Jeremy Murdock, Department of Agricultural and Resource Economics, University of California, Davis, (530) 752-4651. Sample Cost of Production studies for many commodities are available and can be downloaded from the website https://coststudies.ucdavis.edu. Archived studies are also available on the website.

    See the cost study report HERE.